
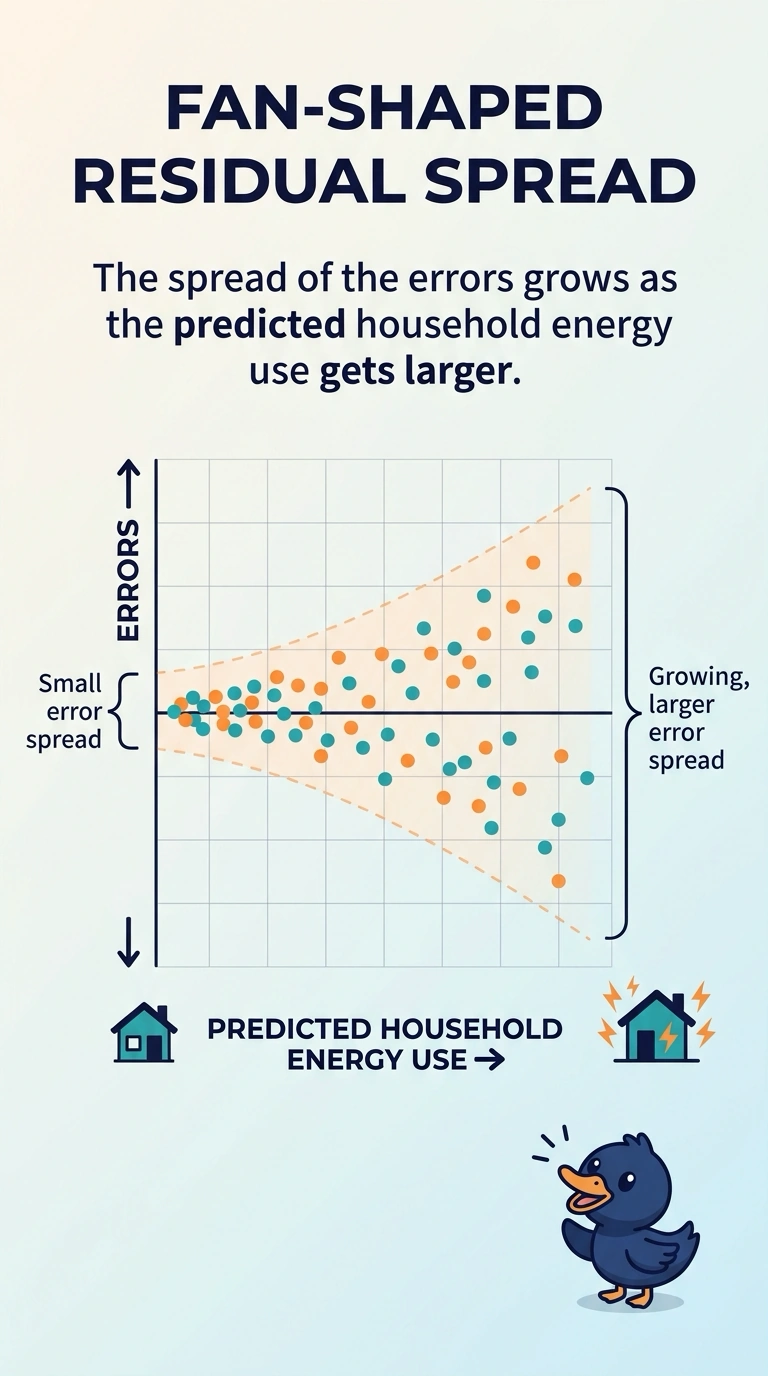
A utility models monthly household energy use. On a plot of residuals against fitted values, the cloud spreads out like a fan as the fitted value rises. What does that shape mean?
Select an answer to reveal the explanation.
Short Explanation
A fan-shaped residual plot is a megaphone, quiet at one end and loud at the other. You are seeing the error spread grow as predicted energy use gets larger. A U-shape would mean a curved average, which is not what a widening fan shows.
Full Explanation
A fan in a residual-versus-fitted plot means the vertical scatter of residuals increases as the fitted value increases. Households predicted to use more energy show a wider range of errors than households predicted to use less, so the variance of the errors is not constant. Constant spread is the opposite reading: it is the pattern a fan rules out, sometimes called homoskedasticity. A missed curve in the mean shows residuals that bend, often in a U or arch, while staying a statement about the average rather than about a widening spread. Isolated spikes are a few distant points, not a cloud that opens steadily across the fitted range. Predictions at the low end of energy use sit in a tight band, while predictions at the high end swing farther above and below the fitted value, which is the opening fan. Chasing a bend in the average would send the team to change the mean when the spread is the feature the plot is actually showing. Exam caveat: a fan describes changing spread and does not, by itself, prove that the average prediction is biased. Operational check: split fitted values into a low band and a high band and confirm the residual spread is wider in the high band.