
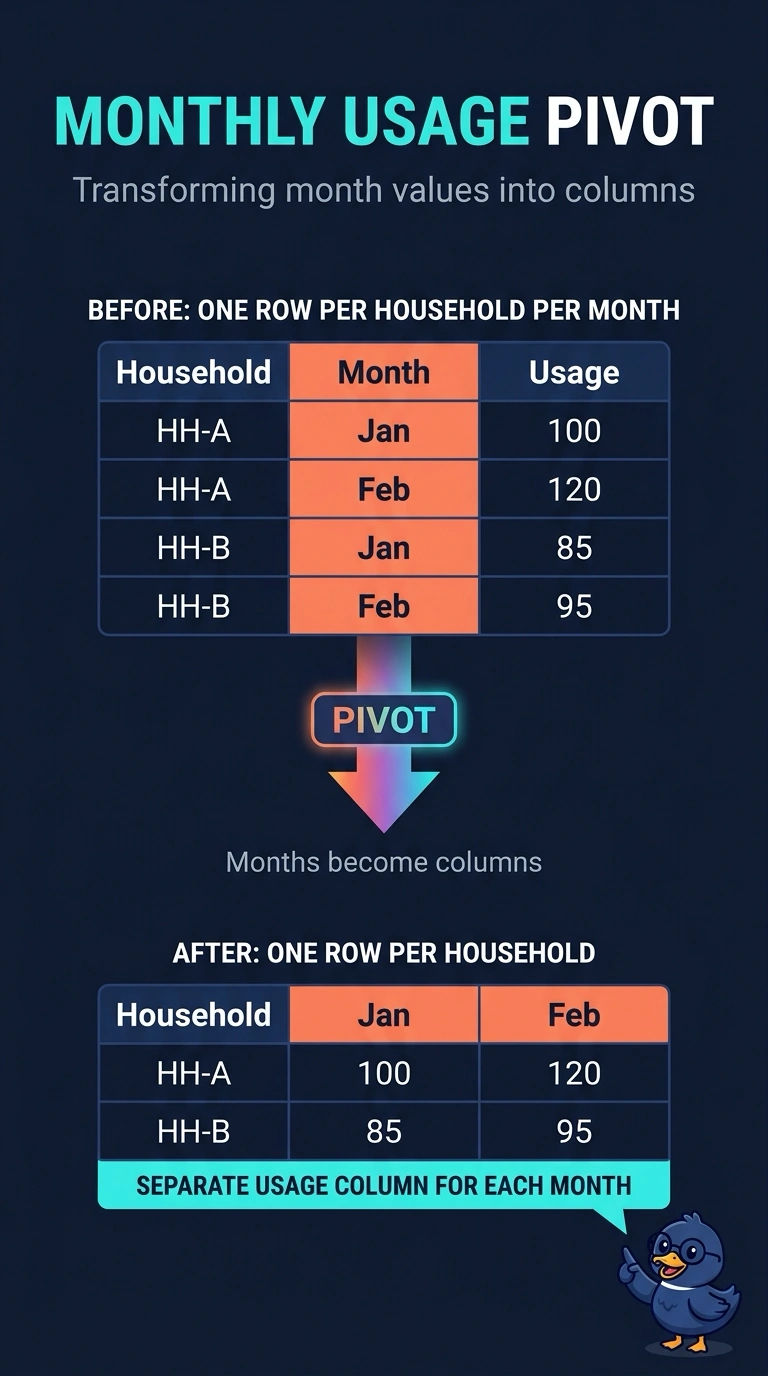
A telecom provider stores one row per household per month, with the month name sitting in a column. Analysts need one row per household and a separate usage column for each month. Which reshape does that?
Select an answer to reveal the explanation.
Short Explanation
You are turning a tall stack of monthly slips into one wide card with a box for each month. A pivot lifts those month values into columns. Filtering to the latest month, or summing the months away, will not build that card.
Full Explanation
A pivot reshapes a table by turning values that currently sit in rows into column headers. Here the month name is a row value, and the analysts want one row per household with a separate usage column for each month. Pivoting on month does that: each distinct month becomes a column, and the usage measure fills the cells. A filter that keeps only the newest month throws away the history the wide layout was supposed to preserve. An aggregation that sums every month into one total collapses the monthly detail into a single number, so the side-by-side month columns never appear. A lookup join can attach a region name, but the month remains a value repeated down the rows, which is the original grain. Exam caveat: a pivot needs a rule when a household has two rows for the same month, usually an aggregate such as sum, or the reshape is ambiguous. Operational check: after the reshape, confirm each household appears once and that a known month's usage matches the source row for that household and month.