
A water utility models monthly household use. When household size doubles, use tends to multiply by a similar factor rather than rise by a fixed amount, and a straight line on the raw use bends. Which transform matches that pattern?
Select an answer to reveal the explanation.
Short Explanation
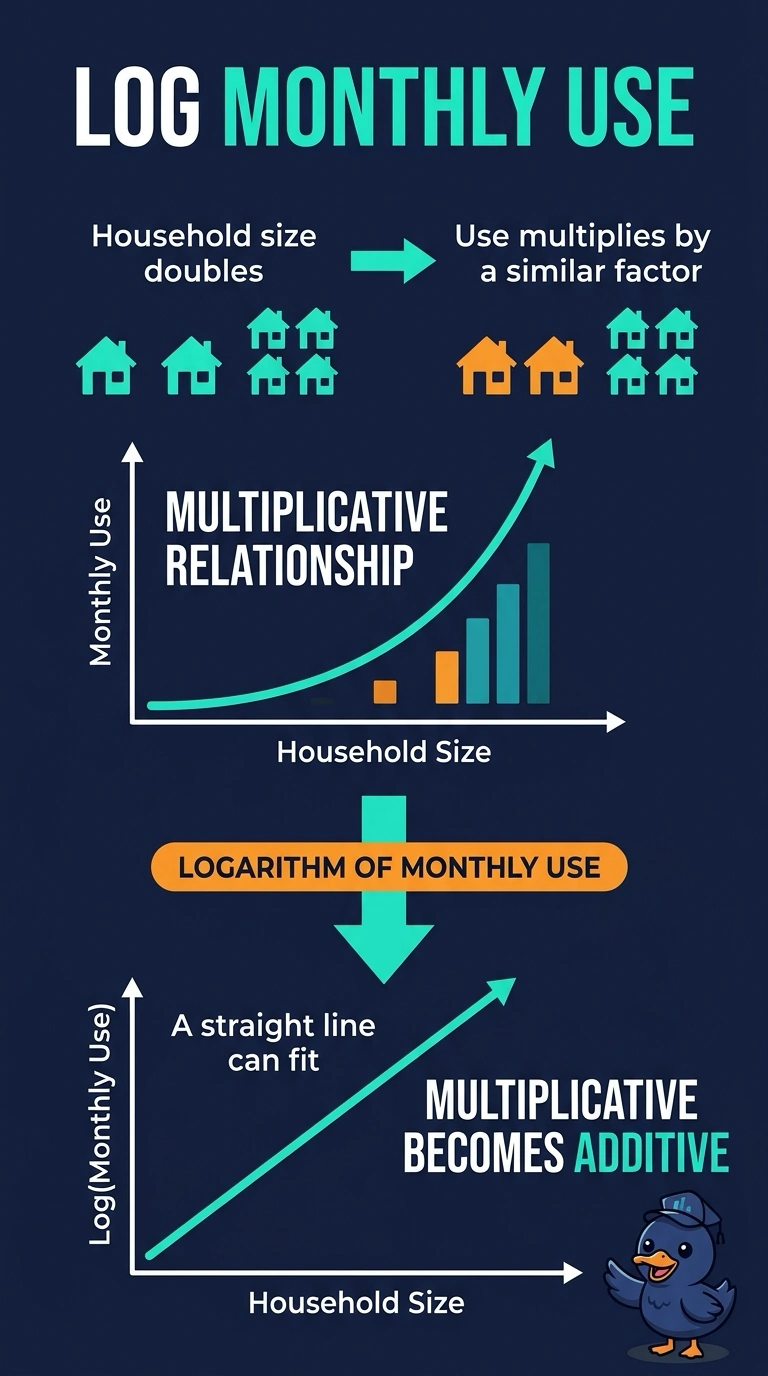
When doubling a cause multiplies the result, adding a straight line to the raw numbers is like forcing a curve into a ruler. A logarithm turns that multiplicative pattern into an additive one your linear model can fit. The trap is a z-score, which recenters the curve and leaves the bend right where it was.
Full Explanation
A logarithm turns products into sums, so a relationship in which doubling household size multiplies use becomes an additive relationship on the log scale. A straight line can then fit log use against size, which is the pattern the water utility saw when the raw line bent. A z-score recenters use and divides by its spread, leaving the multiplicative curve the same shape in new units. Equal-width bins replace the smooth curve with step labels and throw away the within-band differences rather than straightening the multiply-by-a-factor pattern. Min-max scaling squeezes use into a fixed range and likewise preserves the bend. On the log scale, multiplying use by a constant factor becomes adding a constant, so a straight line in household size can track the pattern the raw plot bent away from. A rescaling or a set of bins leaves that multiply-by-a-factor curve intact instead of turning products into sums. Exam caveat: a logarithm is undefined at zero and for negative use, so any zero readings need a stated handling rule before the transform is applied. Operational check: plot use against household size, then plot the log of positive use against size, and confirm the second view is closer to a straight line.