
A bank builds a matrix of merchant-category flags for cardholders, and for any single category almost every cardholder has a zero. An analyst still pictures every flag as a mostly filled column and quotes an ordinary average as if zeros were rare. What property of this matrix is being missed?
Select an answer to reveal the explanation.
Short Explanation
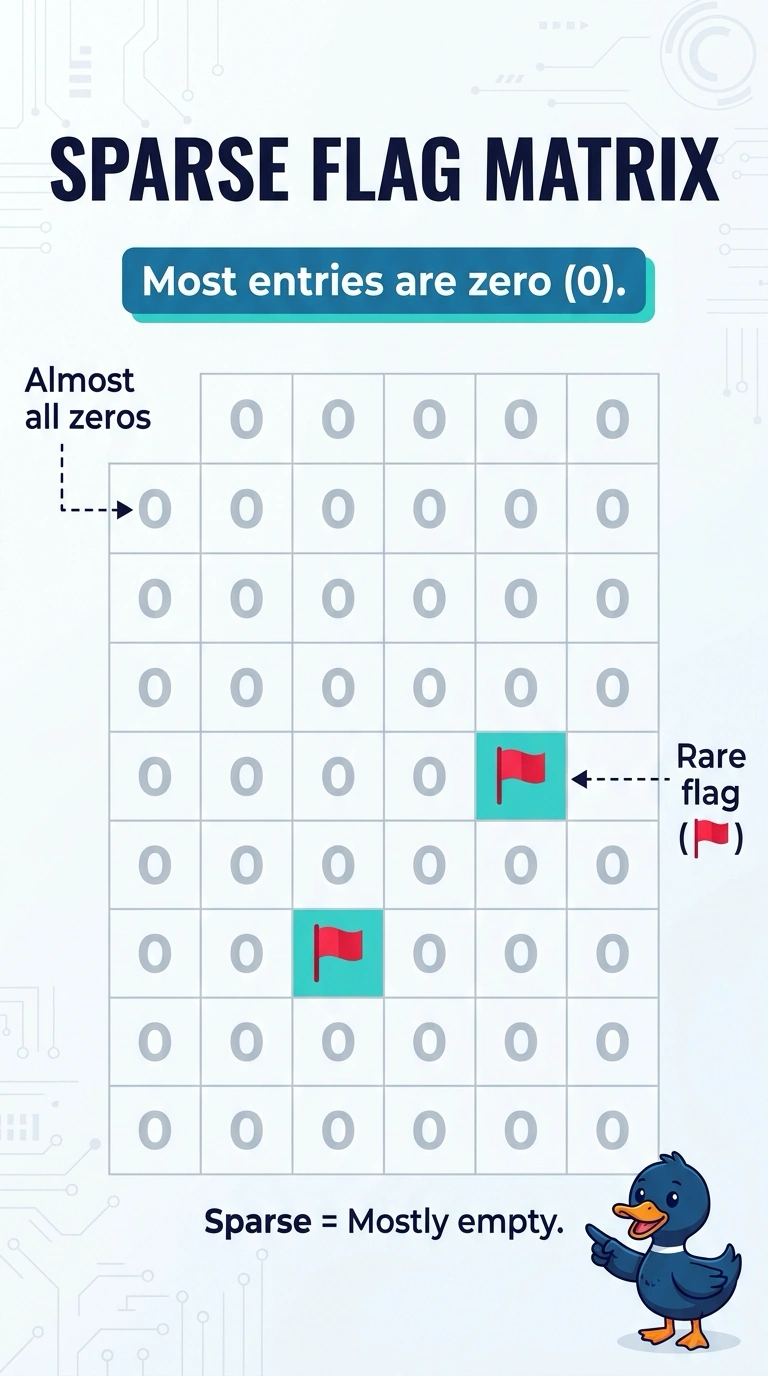
An empty lot is mostly empty spaces, and describing it as if the spaces were full will mislead you. Almost every cardholder carries a zero on any one merchant-category flag, so that column is sparse. The trap is picturing the flags as a dense column where zeros are the rare exception.
Full Explanation
A sparse feature column is one in which most entries are zero or otherwise absent. In this cardholder matrix, almost every row is zero for a given merchant category, so the column is mostly zeros and only a small share of cardholders actually used that category. A mental model that treats the column as mostly filled misreads both the center of the data and any distance or covariance that assumes dense, continuously occupied values. Filling those zeros with a typical nonzero amount treats structural absence as a missing dense measurement. A zero here means the cardholder did not use the category, and imputing a nonzero spend invents transactions. Calling the zero the bottom of an ordinal rating scale also misreads the coding. The flag is a category indicator, not a complete score on which every cardholder was graded. Lockstep columns are a collinearity problem, and nothing in the matrix description says two categories are copies of each other. The striking fact is the mass of zeros inside one column, not agreement between columns. Exam caveat: the average of a zero-one flag still equals the share of cardholders in that category, but that share is not a typical nonzero amount. Operational check: compute the share of exact zeros in the column before you describe its center or choose a dense storage layout.