
A hospital plots monthly emergency arrivals across several years. The average level climbs steadily, and the month-to-month spread widens in the later years. A forecasting notebook still treats the level and the spread as constant over time. What property is being ignored?
Select an answer to reveal the explanation.
Short Explanation
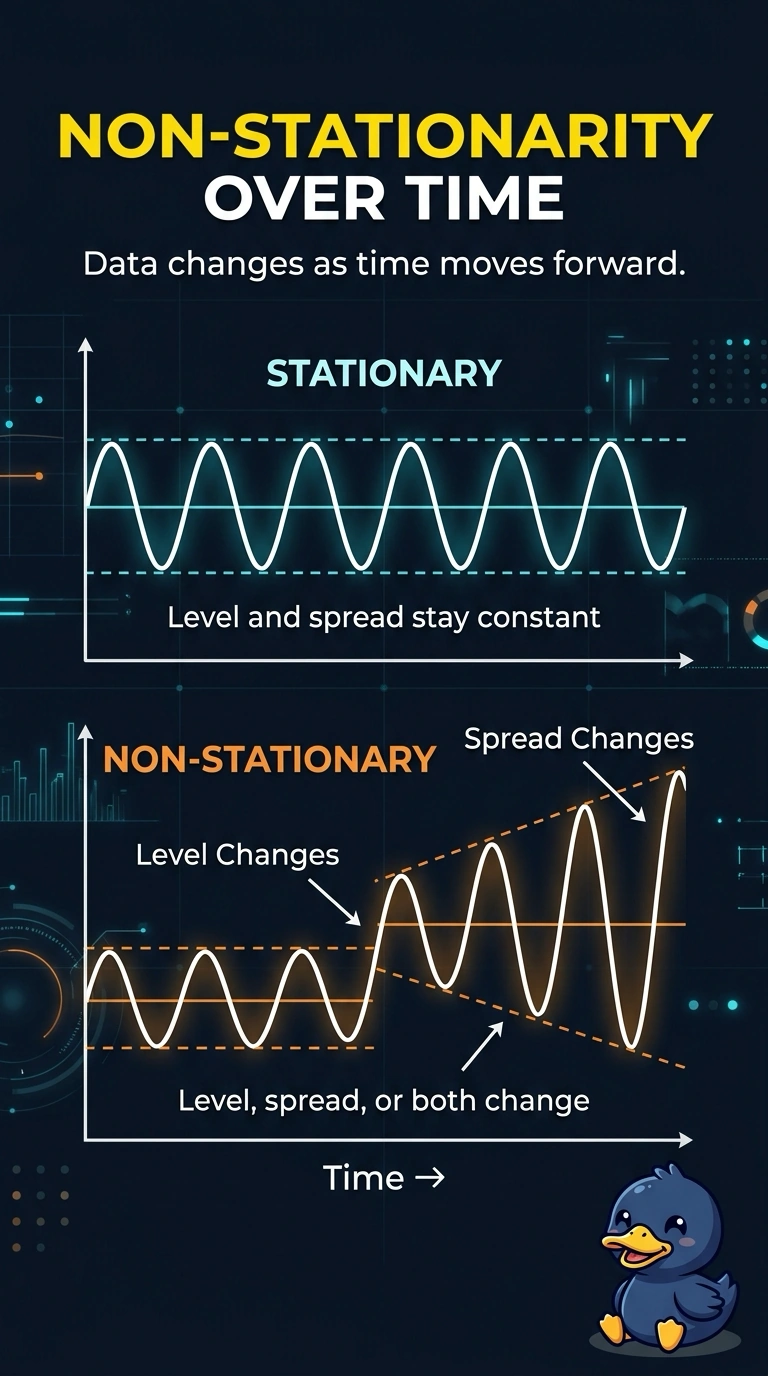
A shoreline that creeps up the beach and fans out is not a fixed waterline. You are watching emergency arrivals whose level climbs and whose spread widens across years. The trap is calling that a seasonal wiggle whose width stays constant.
Full Explanation
A series is non-stationary when its statistical behavior changes with time. A constant mean and a constant spread are part of what a stationary series keeps still. Monthly emergency arrivals here have a level that climbs across years and a month-to-month spread that widens later. Both the center and the spread depend on when you look, so the series is non-stationary. A notebook that treats level and spread as constant is ignoring that property. Seasonality alone would be a repeating within-year pattern. The option that calls the multi-year climb a pattern inside each year, and that claims the spread stays fixed, contradicts both facts in the plot. A seasonal cycle can exist in a series, but it is not a description of a steady climb plus a widening spread. Multicollinearity is high correlation among predictors. A widening spread is not two columns moving in lockstep, and the stem has not introduced a second predictor. A lag is a prior value used as an input. The climb is visible in the arrivals themselves. It does not depend on pasting last month into a feature column. Exam caveat: a series can be non-stationary because the level moves, because the spread moves, or both, so it is enough that one of those is changing. Operational check: plot a rolling mean and a rolling spread across the years and confirm both are in motion before you fit a model that assumes they are fixed.