
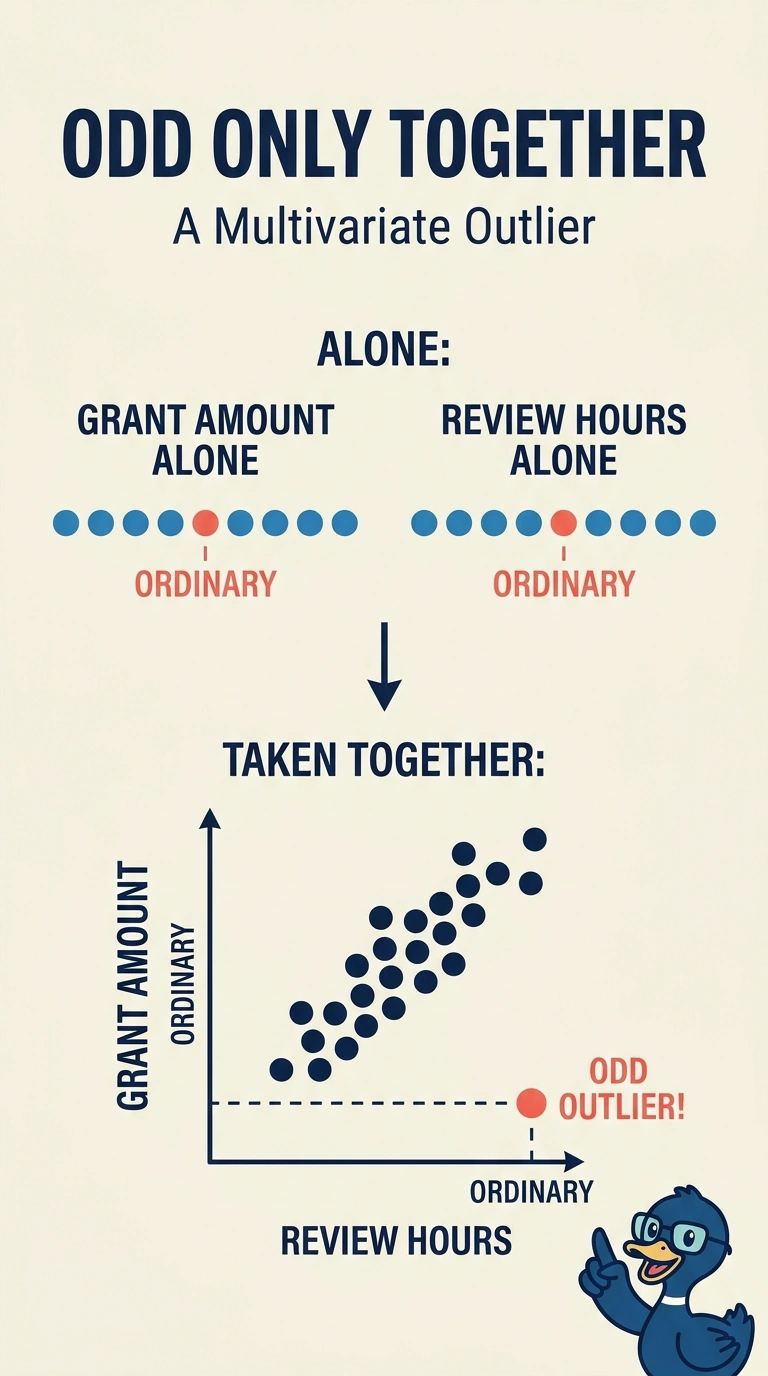
An agency plots grant amount against review hours. One application sits near the middle of the grant-amount axis and near the middle of the review-hour axis, yet no other application pairs a mid-size grant with that many hours. What kind of odd point is this?
Select an answer to reveal the explanation.
Short Explanation
A shirt size that is ordinary and a price that is ordinary can still form a strange outfit when you put them together. This grant is a multivariate outlier: each axis looks typical, and only the combination is odd. The trap is hunting for a single-axis extreme that the plot does not show.
Full Explanation
A multivariate outlier is unremarkable on each variable alone and unusual only in the combination. This application sits near the middle of grant amount and near the middle of review hours, so neither margin flags it, yet the pair does not occur among the other applications. That is a multivariate outlier. A univariate outlier on grant amount would sit in the tail of grant amount, which a mid-range value does not. A seasonal spike would be a repeating calendar pattern, and the plot described is a two-variable scatter with no time cycle identified. A one-axis extreme on review hours would be far out on the hour axis even without the grant amount, which contradicts the statement that the hours are near the middle of that axis. Exam caveat: checking each column's range separately will miss a point that is typical on every margin and odd only jointly. Operational check: mark the point on each axis histogram and on the joint scatter, and confirm it is central in both histograms and isolated in the scatter.