
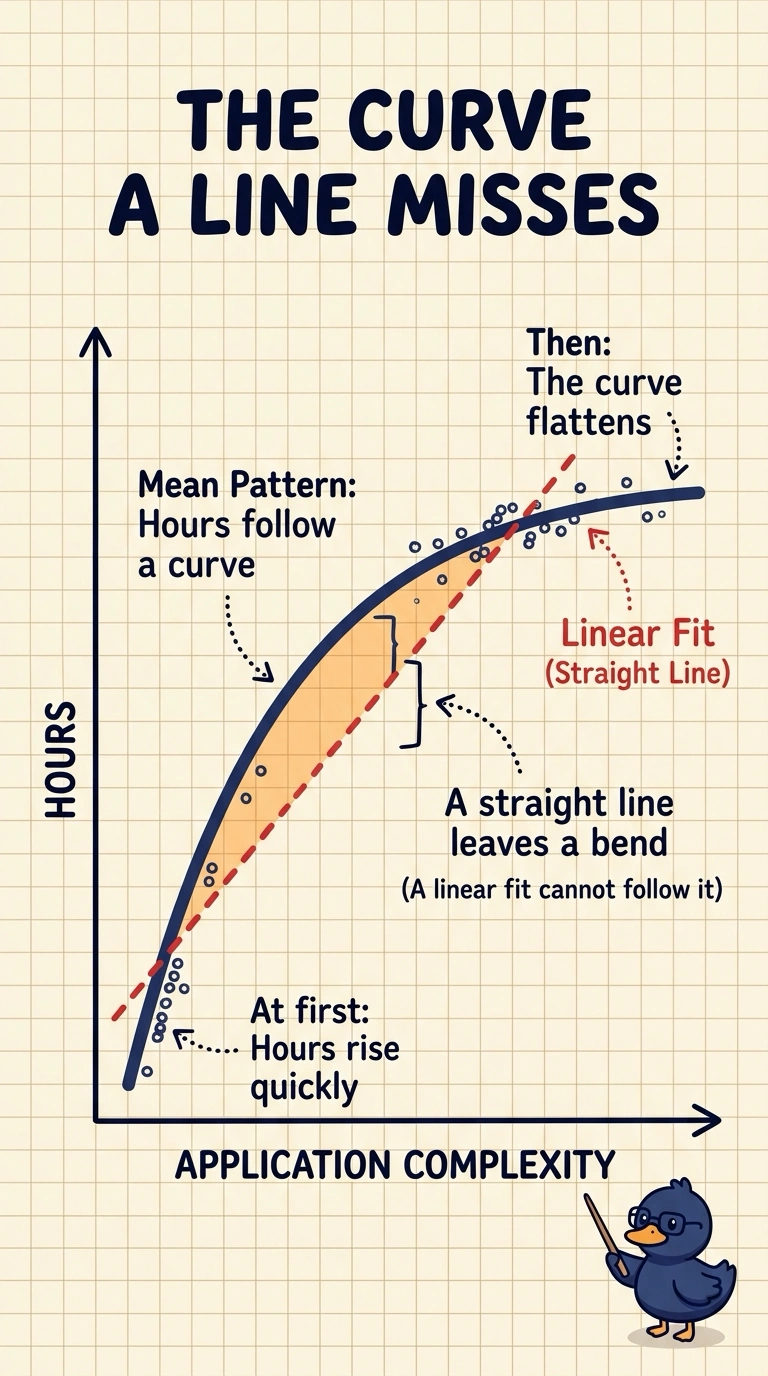
An agency plots permit-processing hours against application complexity and sees a smooth curve that rises quickly and then flattens. The fitted model is a single straight line through that cloud. What is the fit failing to capture?
Select an answer to reveal the explanation.
Short Explanation
You can’t make a ruler trace a bend just by pressing harder. The straight line misses the curve because the mean hours rise quickly and then flatten as complexity increases. You’re seeing curvature, not evidence of a data defect.
Full Explanation
A straight-line fit assumes that the mean of processing hours changes at a constant rate as application complexity increases. Here, the mean rises quickly and then flattens, so it follows a curve that a single straight line cannot capture. The line will sit above the cloud in some regions and below it in others; those patterned gaps indicate missed curvature rather than random noise. Calendar drift would mean that the level of processing hours changes across months, but the plot relates hours to complexity, not time. Sparse complexity codes would mean that most applications have a zero complexity value, whereas the described smooth curve shows a relationship across complexity values. A missing lag would mean that an earlier period’s hours should be used as a predictor; this fit’s problem is not the absence of a prior time step, but the overly rigid straight-line form for the complexity relationship. Exam caveat: a straight line can still be a useful rough summary, but an obvious bend means it is the wrong mean function for that relationship. Practical check: plot residuals against complexity and look for a systematic curve rather than a formless cloud before keeping the linear fit.