
A benefits agency must chart two things: how many applications fall in each program, and how processing time, a continuous measure in hours, is distributed. Which pairing of displays is appropriate?
Select an answer to reveal the explanation.
Short Explanation
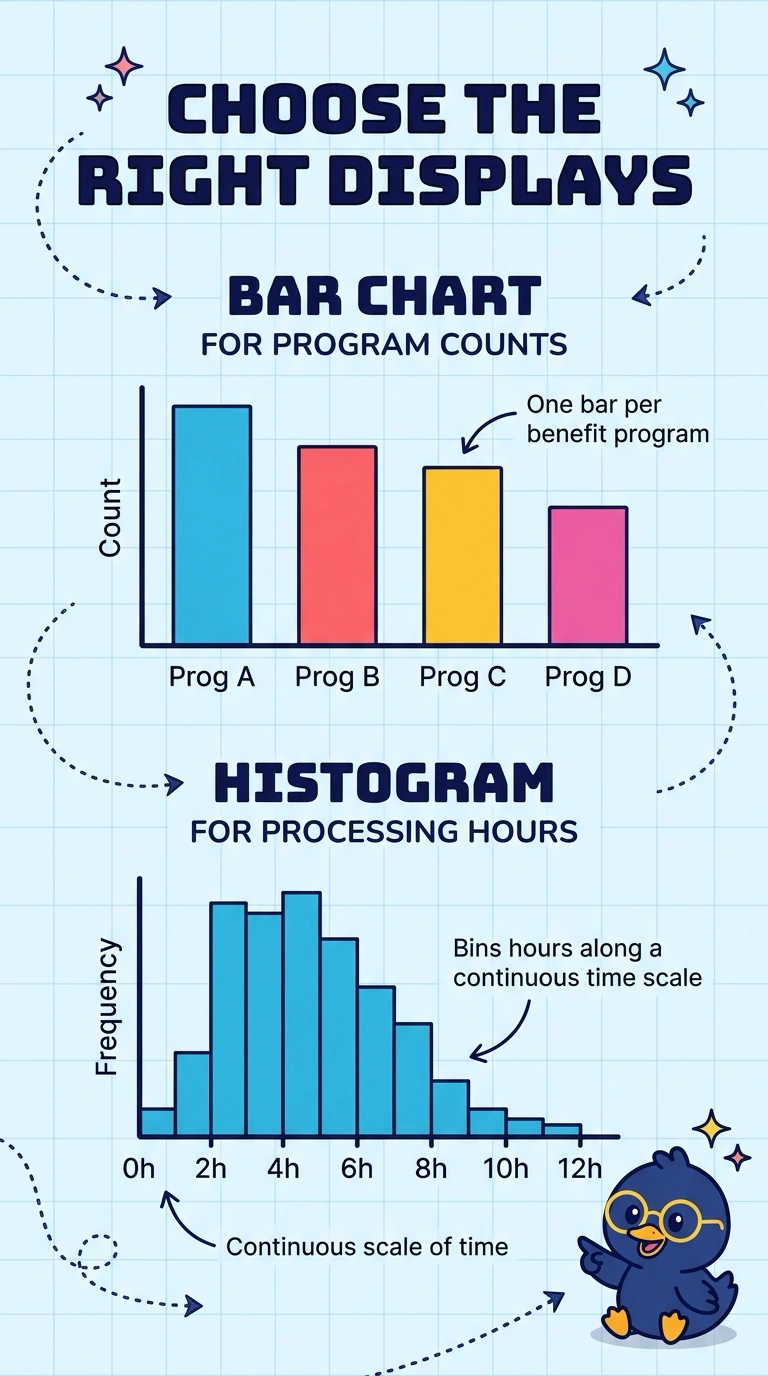
Bars are for named buckets you can count, and a histogram is for a continuous measure you slice into bins. The trap is swapping them because both drawings look like a row of bars. Use a bar chart for benefit programs and a histogram for processing hours.
Full Explanation
Program names are categories, so a bar chart with one bar per program shows the count in each category, and the bars are separate because the programs are not intervals on a numeric scale. Processing time in hours is continuous, so a histogram bins that numeric axis and shows how applications are distributed along it. Swapping the displays treats a category count as if it were a continuous measurement and treats hours as if they were named groups with no numeric order. A scatter plot needs two numeric coordinates for a point; a program name is not a number, and one cloud of points would not show program counts and the hour distribution as two separate pictures. A line plot connects values in an order, which suggests a sequence such as time, but program names do not form a time order and a distribution of hours is not a series to connect. Exam caveat: histograms and bar charts can look similar on the page, and the deciding fact is whether the axis is a set of categories or a continuous measurement cut into bins. Operational check: confirm in the data dictionary that program is a category and that processing time is a continuous hour measurement before choosing the chart for each.