
A steel mill wants to show how tons of incoming material move from supplier categories into product families and then into finished coils or scrap. Which display is built for that question?
Select an answer to reveal the explanation.
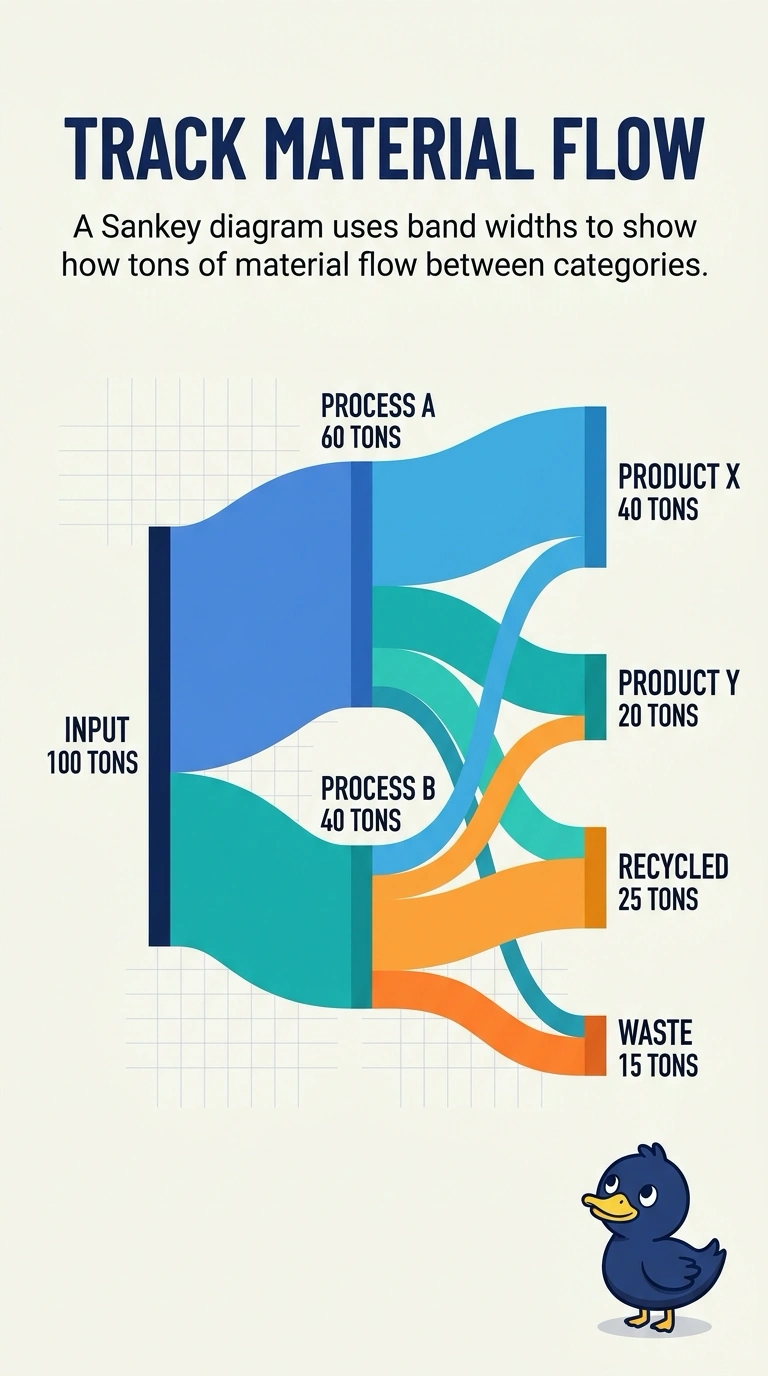
Short Explanation
You can picture the material flow like rivers on a map: wider channels show more tons moving from one category to the next. A histogram, scatter plot, or box plot shows a distribution, a relationship, or a spread—not the path of the tons. You want a Sankey diagram.
Full Explanation
A Sankey diagram displays a quantity moving from one set of categories to another, with each band’s width proportional to the amount on that path. Supplier category, product family, and finished coil or scrap are successive stages, and the tons are the quantity being followed, so this diagram directly answers the question. A histogram bins one continuous measurement, such as finished-coil weight, and shows how many observations fall in each bin; it does not trace tons from a source category to a destination. A scatter plot places one point per work order on two numeric axes, such as unit cost and cycle time, showing a pairwise relationship rather than material flow. A box plot summarizes the median and spread of a numeric measure, such as cycle time, within each product family; it does not show how much material leaves one category and arrives in another. Exam caveat: the bands show quantities along category-to-category paths, so the diagram is most informative when the stages and categories are defined clearly. Practical check: confirm that the widths leaving each supplier category add up to that category’s tons, and that those tons reappear in the product-family and finished-coil or scrap bands.