
A municipal water utility wants a first look at daily treated volume across a year and needs the days kept in calendar order. Which display should the utility start with?
Select an answer to reveal the explanation.
Short Explanation
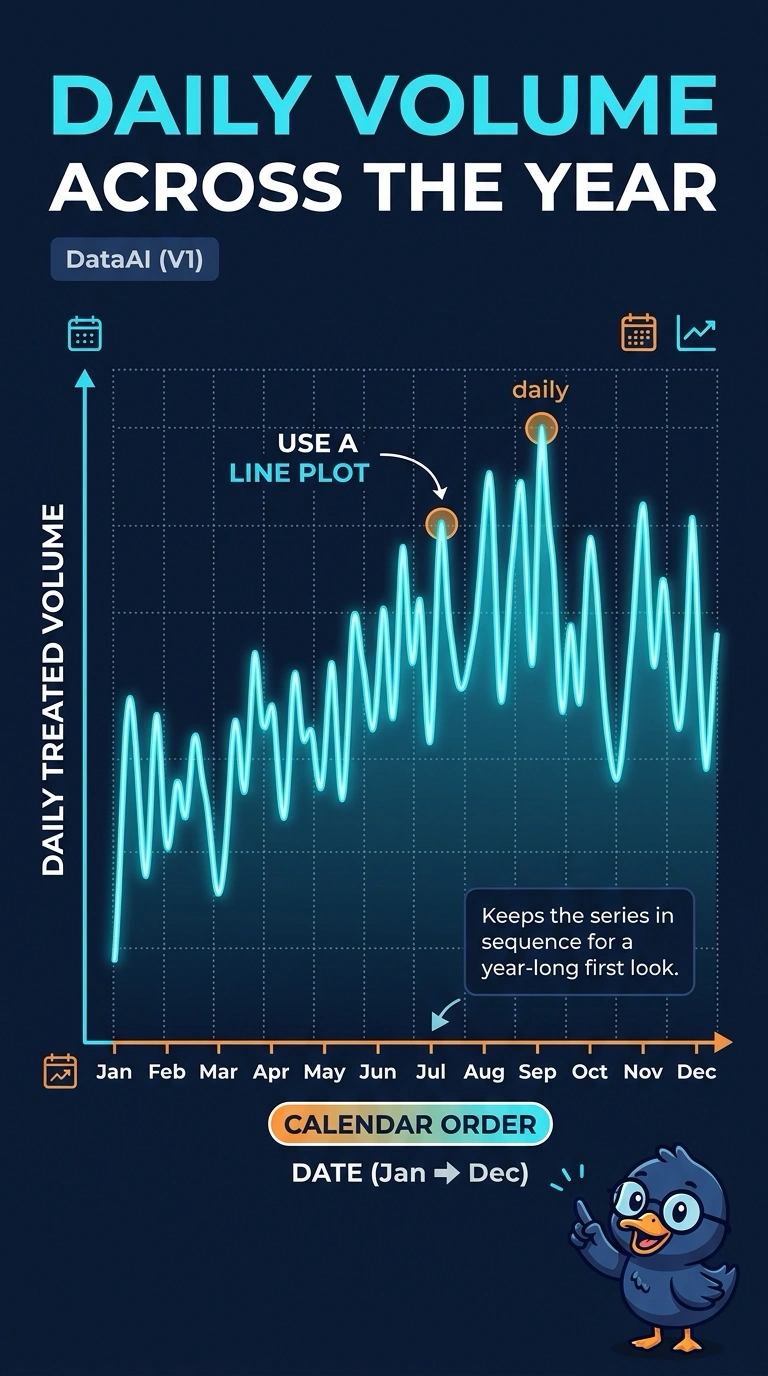
If the story is a value walking through the calendar, you draw a line that follows the days instead of a pile that forgets the order. The trap is binning the volumes, charting plants instead of time, or pairing the series with itself. Start with a line plot of treated volume against the date.
Full Explanation
The utility wants a first look at one value, daily treated volume, ordered by calendar date across a year. A line plot puts the date on the horizontal axis and connects the volume in that order, so level, jumps, and quiet stretches show up in sequence. That is the display to start with. A histogram bins the volumes and counts how many days fall in each bin, which describes the distribution and deliberately drops the calendar order the utility said it needs. A bar chart with one bar per plant compares plants and has no day axis, so it does not show the year in order. A scatter-plot matrix is for relationships among several numeric variables; pairing volume with itself and ignoring the sequence of days does not produce a time-ordered view of the series. Exam caveat: a line plot is the right first look for order in time, and a later histogram can still be useful if the question changes to the shape of the volume distribution without dates. Operational check: confirm the horizontal axis is the date in calendar order and that each point is that day's treated volume before reading any rise or drop.