
A hospital analyst wants to see how length of stay, measured in hours, is spread across one year of adult admissions. Which display shows the distribution of that single continuous variable?
Select an answer to reveal the explanation.
Short Explanation
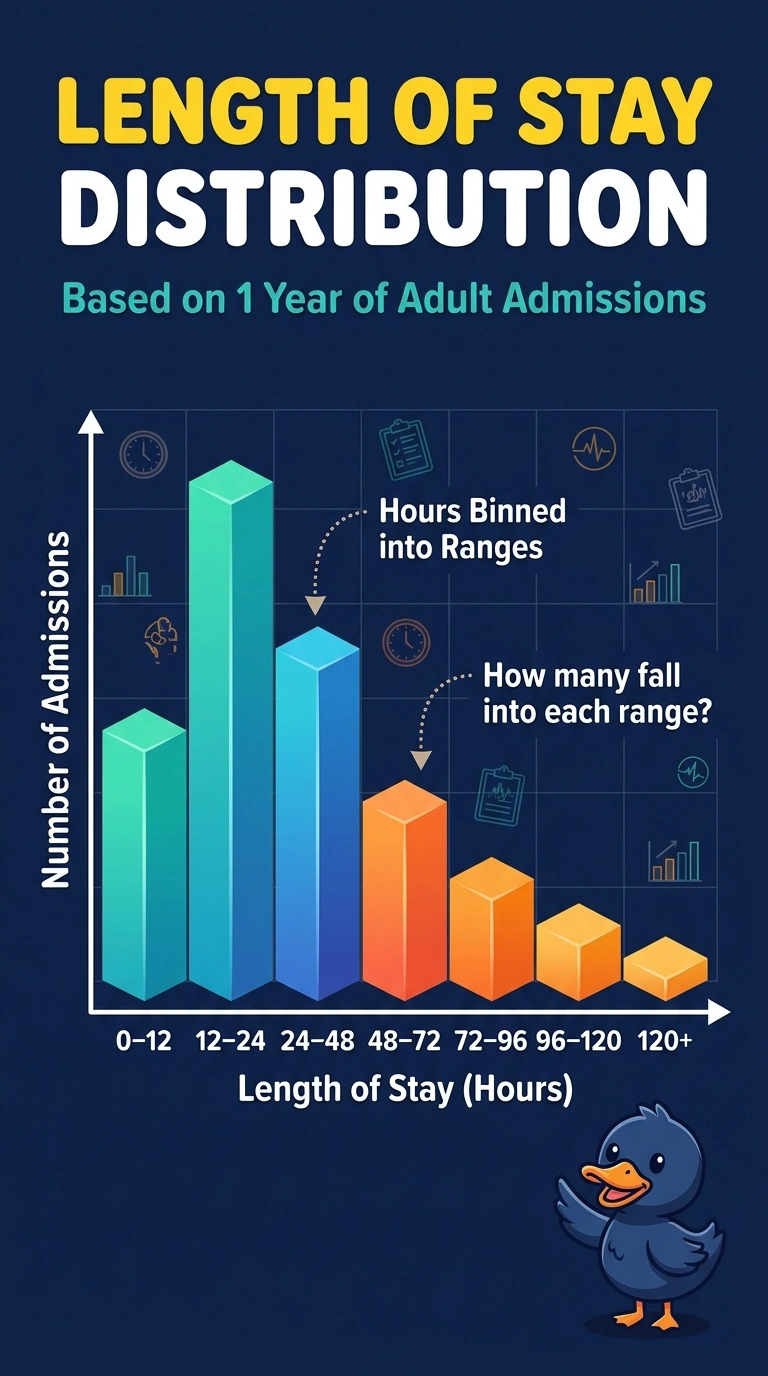
If you want the shape of one pile of hours, sort them into bins and see which bins get tall. That display is a histogram of length of stay. A dot for every age, a bar per department, or a monthly average answers a different question.
Full Explanation
A histogram takes one continuous variable, cuts its range into bins, and draws a height for how many observations fall in each bin. Length of stay in hours, across admissions, is exactly that kind of variable, so the histogram shows the distribution the analyst asked for: where stays pile up and where they thin out. A scatter plot needs a second continuous measure and shows the joint pattern of the pair, not the one-variable distribution of hours. A bar chart of department names is a count of categories; the departments are labels, not bins of a continuous stay. A line of monthly averages tracks a summary over time and hides how individual stays are spread inside the year. Exam caveat: a histogram is not a bar chart of named groups, even though both use bars; the horizontal axis of a histogram is a numeric scale that has been binned. Operational check: confirm the horizontal axis is hours of stay in ordered bins and the vertical axis is a count or rate of admissions, with no second measurement encoded on the plot.