
A hospital laboratory has several numeric lab measures on each admission and wants one view of how every measure relates to every other measure. Which display provides that view?
Select an answer to reveal the explanation.
Short Explanation
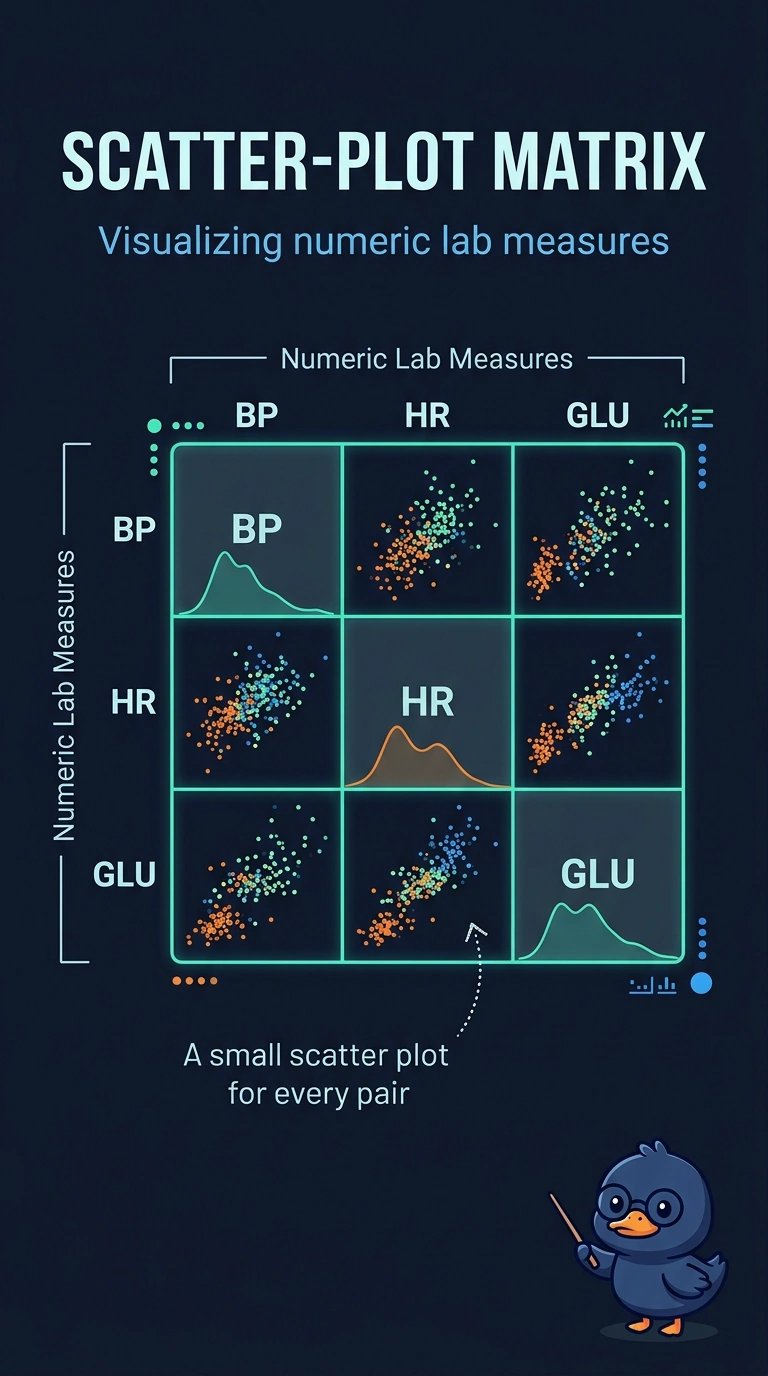
A scatter-plot matrix gives you a small plot for every pair of numeric lab measures, so you can scan their relationships in one view. A shared histogram, a Sankey flow diagram, and bars of averages each leave out the admission-level pairing you need. Choose the matrix when you want every measure compared with every other one.
Full Explanation
A scatter-plot matrix, sometimes called a pairs plot, lays out a small scatter plot for each pair of numeric variables. With several lab measures, that layout shows every pairwise relationship in one view, which is what you need. A single histogram shows a one-variable distribution, not how one measure relates to another; pooling different measures into common bins also mixes values that may have incompatible scales. A Sankey diagram represents amounts flowing between categories, but lab measures are paired numeric observations, not transfers from a source category to a destination. A bar chart of averages reduces each measure to one number and loses the admission-level pairing that reveals how two measures vary together. Exam caveat: the scatter-plot matrix displays pairwise association, not evidence that one lab measure causes changes in another. Practical check: count the off-diagonal panels and confirm there is one scatter plot for each unordered pair of lab measures you want to compare.