
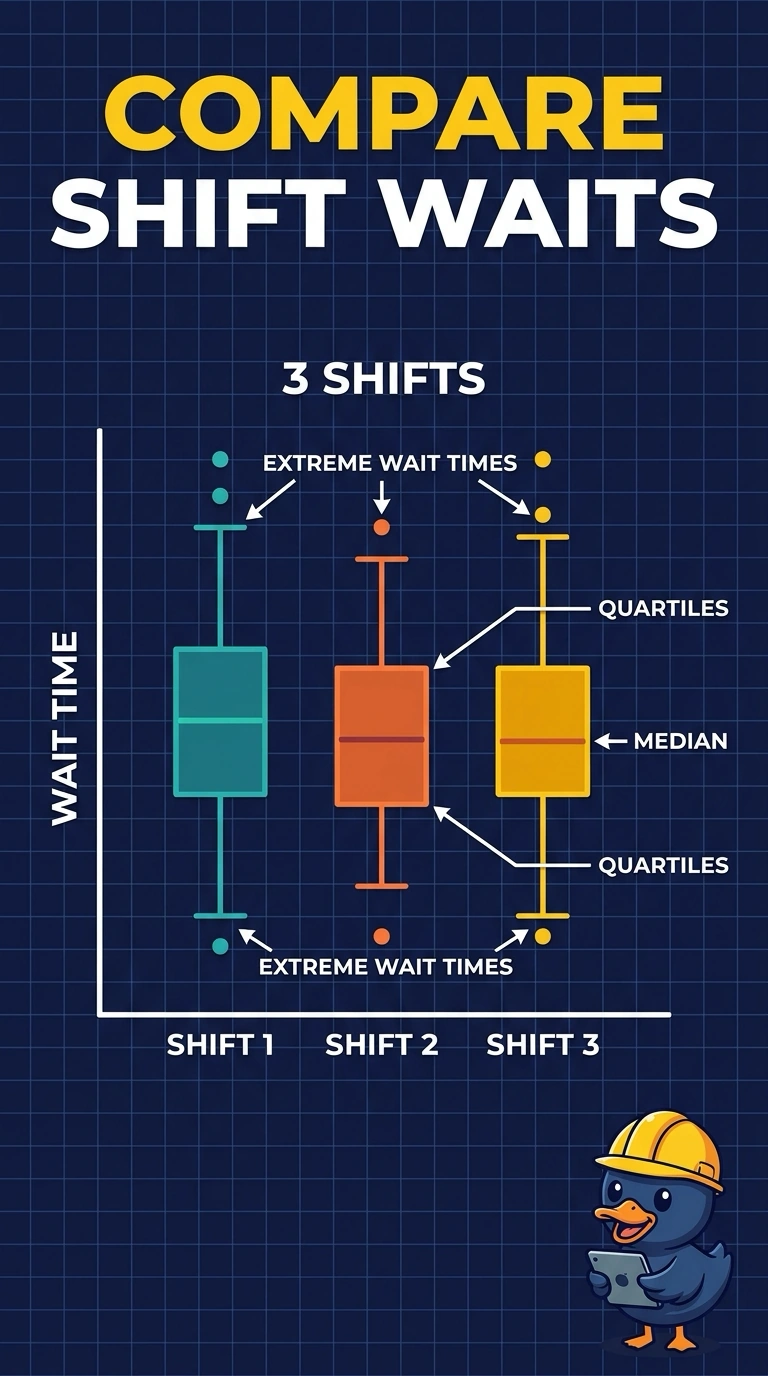
A hospital wants to compare emergency-department wait times across three shifts and to show the median, the quartiles, and the waits that sit far from the rest. Which display does that?
Select an answer to reveal the explanation.
Short Explanation
Think of a small snapshot of each shift: where the middle wait sits, where the middle half sits, and which waits stick out. You want a box plot per shift. A bar of averages, or one histogram of every shift pooled, throws away the quartiles you were asked to show.
Full Explanation
A box plot summarizes one numeric distribution with the median, the quartiles, and the points that sit far from the rest, and it can draw that summary once per group. Three shifts, with wait time as the continuous measure, line up with one box per shift so the medians, quartiles, and extreme waits can be compared. A histogram that pools every shift into one set of bins shows a single overall shape and hides the shift comparison the hospital asked for. A scatter plot of wait against arrival hour can show individual patients, but it does not mark the median and quartiles of each shift. A bar of mean wait per shift collapses each shift to one average and omits spread, quartiles, and extreme waits. Exam caveat: the box plot is a summary of the distribution, not a display of every patient's exact wait, so a shift with the same box can still hide a different count of patients. Operational check: confirm there is one box per shift and that each box shows a median, a quartile box, and the extreme waits, rather than a single mean bar.