
A city agency wants to see whether emergency-call response time in minutes rises with distance in miles, using one point per call. Which chart shows those two continuous measures together?
Select an answer to reveal the explanation.
Short Explanation
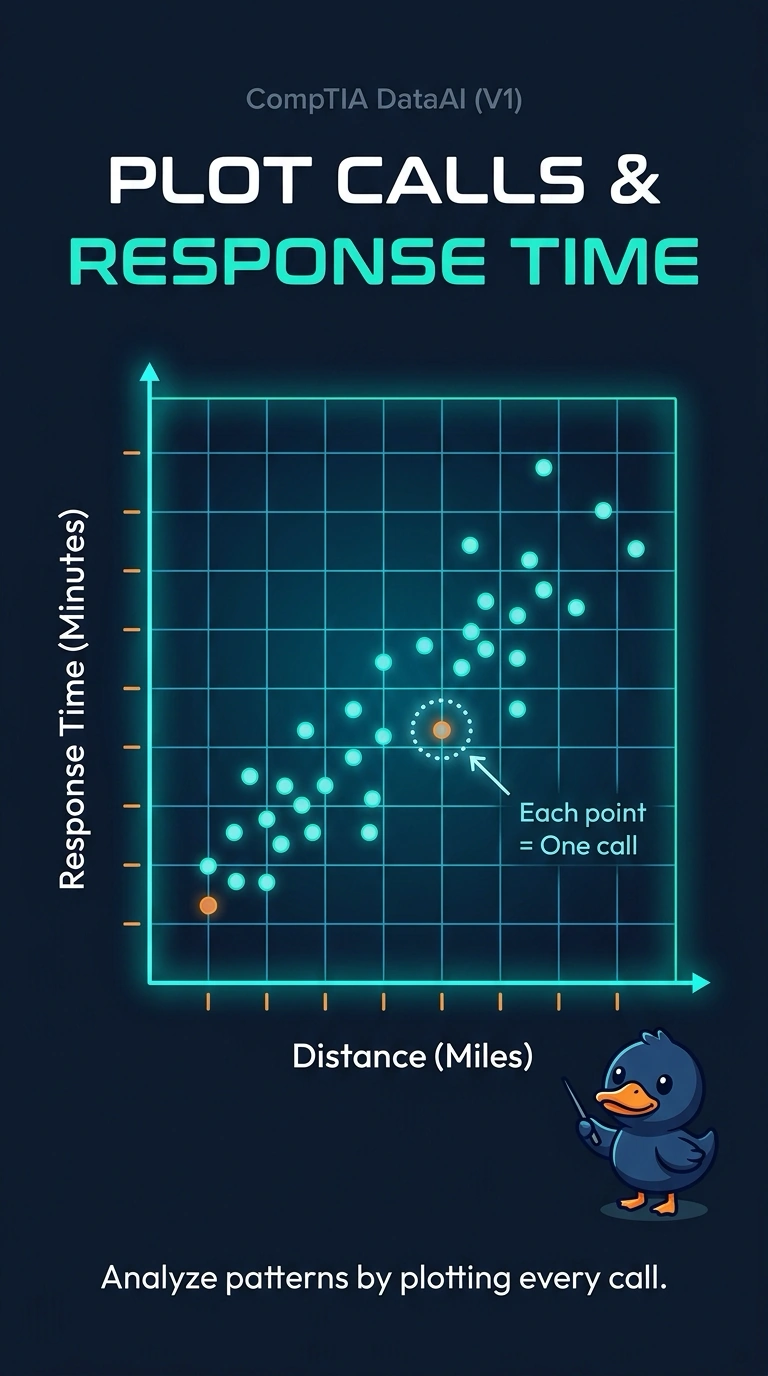
To see whether two measurements rise together, you can put one dot down for each call. A scatter plot of miles against minutes keeps each call’s pair of values visible. A histogram of response time alone, a neighborhood-count bar chart, and a grid of pairwise summaries do not show that call-level relationship.
Full Explanation
A scatter plot places one continuous variable on each axis and draws one point per observation, so you can see whether response time rises with distance. Each call keeps its own pair of values, so a long trip that is also a slow response stays visible instead of being averaged away. Minutes and miles are both continuous, and the agency asks for one point per call, making the call the scatter plot’s unit. A histogram bins response time alone, so it cannot show how time lines up with distance. A bar chart of call counts by neighborhood summarizes a category and, as described, has neither a miles axis nor a minutes axis. A correlation grid compresses many numeric pairs into summary cells; it does not draw one point per call for this specific pair. Exam caveat: a scatter plot shows the joint pattern, including clumps and curves, while a single correlation number would collapse that picture to one summary. Practical check: confirm that each point is one call, the axes show distance and response time, and neighborhood totals have not replaced the call-level points.