
A utility analyst has dozens of numeric sensor streams from one plant and wants a compact view of how strongly each pair moves together. Which display is that summary?
Select an answer to reveal the explanation.
Short Explanation
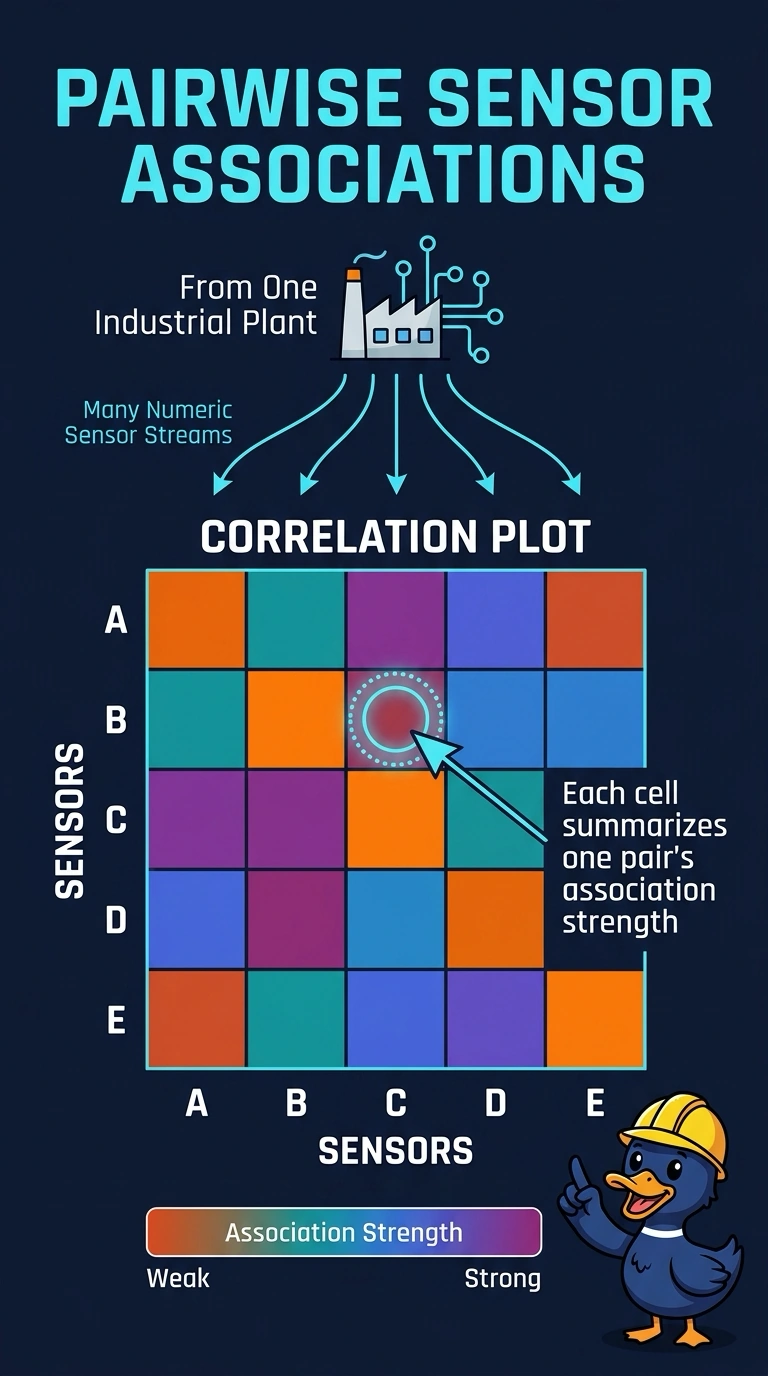
When dozens of sensors need a who-moves-with-whom summary, you want the grid of pairwise associations, not one pretty line. A correlation plot is that grid. One histogram or one time line inspects a single stream and stays silent about the other pairs.
Full Explanation
A correlation plot lays numeric features along both axes and fills each cell with a summary of how strongly that pair is associated. The cell is a summary, not a time series, so dozens of pairs can be scanned without a separate chart for each stream. Dozens of sensor streams and a request for a compact view of every pair match that display. A scatter plot of two chosen streams shows the hour-level points for one pair only and leaves the other pairs undrawn. A histogram of a single stream shows that sensor's own distribution and contains no association between streams. A line chart of one stream over the month shows time, not a comparison with the other sensors. Exam caveat: the correlation plot summarizes pairwise association; it does not by itself prove that one sensor causes another, and a strong cell can still reflect a third factor they share. Operational check: confirm both axes list the numeric streams, each cell is a pairwise association, and streams that are not numeric were kept off the grid.