
A media team wants the full density shape of watch time, not only the quartiles, drawn separately inside each content genre. Which display shows that shape?
Select an answer to reveal the explanation.
Short Explanation
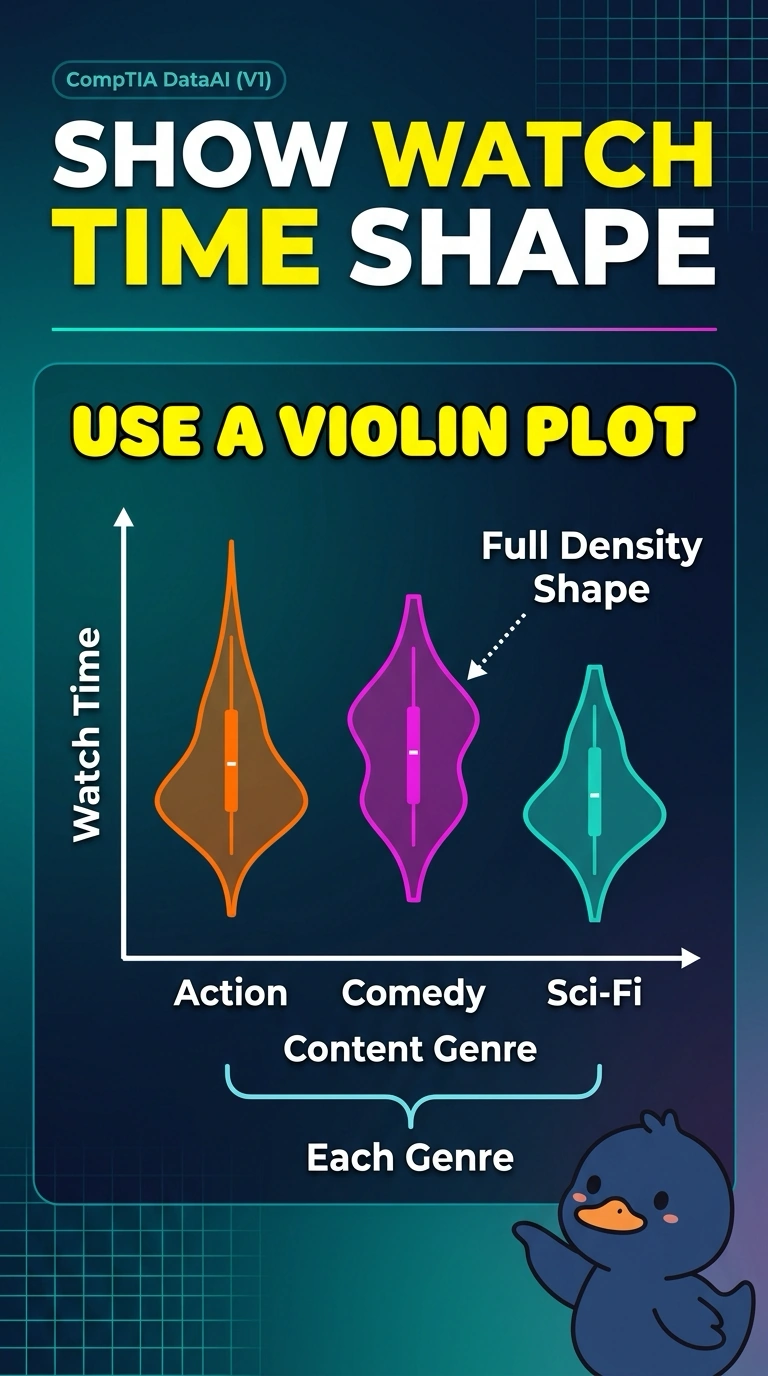
A violin plot lets you see the whole shape of watch time inside each genre, bumps and all, not just the box in the middle. You want that full density by category. A box plot withholds the shape, and one pooled histogram erases the genre split.
Full Explanation
A violin plot draws a density estimate for a numeric variable inside each category, so the full shape of the distribution is visible, not only a quartile summary. That shape can show a second bump, a long tail, or a pile-up of short watch times that quartiles alone would flatten. Watch time by content genre is that request: a separate density inside each genre. A box plot shows the median, quartiles, and extreme points and withholds the full density, so two genres with the same box can hide different shapes. A histogram that pools every genre into one density shows an overall shape and drops the within-genre comparison. A bar chart of how many titles sit in each genre counts titles; it does not show the density of watch time at all. Exam caveat: the violin shows the shape of watch time, and a wider bulge is a denser region of hours, not a larger count of titles by itself. Operational check: confirm there is one violin per genre, the axis is watch time, and the drawn form is a density rather than a quartile box or a title count.