
A retail pricing team wants to judge whether store-level margin values line up with a normal reference by comparing quantiles rather than bin counts. Which display makes that comparison?
Select an answer to reveal the explanation.
Short Explanation
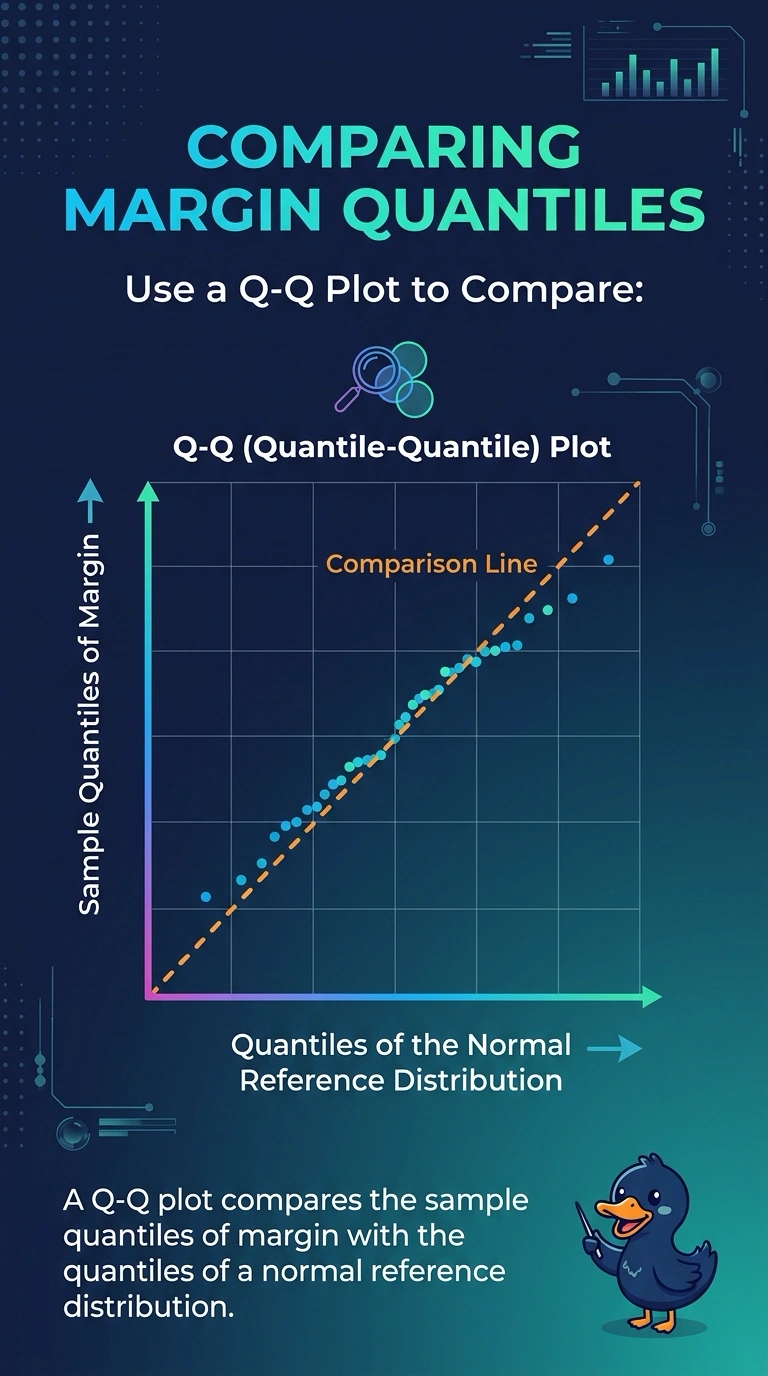
A Q-Q plot lines the sample's quantiles up against a reference distribution's quantiles, like checking whether two ladders share the same rungs. You want that for store margins against a normal reference. A histogram counts bins, and a box plot stops at quartiles, so neither makes that match.
Full Explanation
A Q-Q plot pairs quantiles of the sample with quantiles of a reference distribution and plots those pairs. If store margins line up with a normal reference, the points fall near a straight line; bends show where the sample's quantiles depart from that reference. The pricing team asked for a quantile comparison rather than bin counts, which is this plot. A histogram shows how many margins fall in each bin and does not match each sample quantile to a reference quantile. A box plot marks the median and quartiles of the sample and stops there, without a quantile-by-quantile comparison to a normal reference. A scatter plot of margin against store size displays two business measures and is not a check against a reference distribution. Exam caveat: a Q-Q plot is a visual comparison of quantiles, not a formal pass-or-fail test by itself, so a mild wobble is not an automatic rejection of the reference. Operational check: confirm the vertical position is the sample quantile of margin, the reference axis is the normal quantile, and the chart is not a histogram of bin counts.