
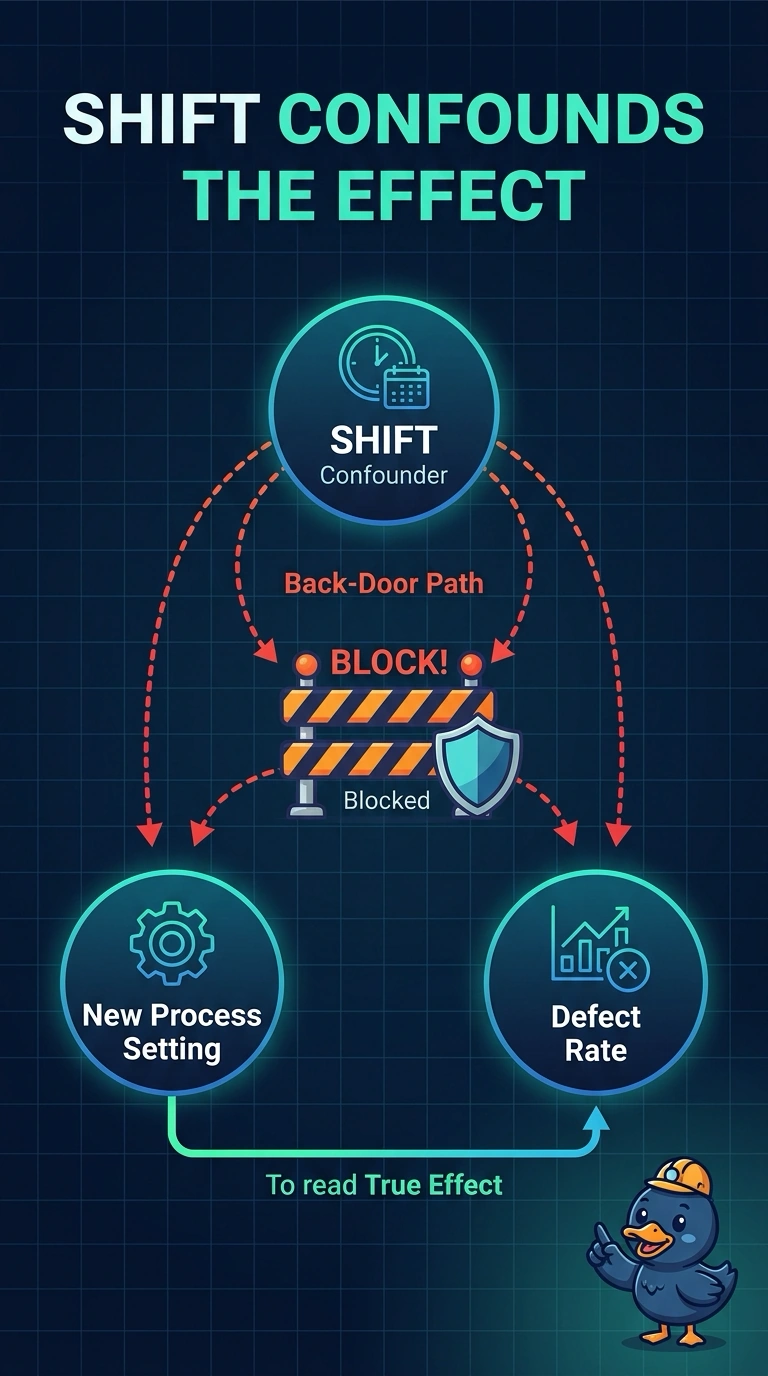
A factory quality diagram draws arrows from shift to a new process setting and from shift to the defect rate, plus an arrow from the setting to the defect rate. Before the team claims the setting caused the defect change, what is shift on that diagram?
Select an answer to reveal the explanation.
Short Explanation
Arrows from shift into both the setting and the defects are a side door around the claim you want. You are looking at a confounder that opens a back-door path, and that path has to be blocked. The trap is calling shift a mediator, a collider, or an instrument when the arrows say otherwise.
Full Explanation
The diagram shows shift causing both the process setting and the defect rate, with a separate arrow from the setting to defects. The direct arrow is the causal path under study. The other route, from the setting back to shift and then forward to defects, is a back-door opened by a common cause. Shift is that confounder, and the effect is not identified while the back-door stays open, so the path has to be blocked, for example by conditioning on shift. A mediator would sit on the path from setting to defects, which would require arrows from the setting to shift and from shift to defects; those arrows are not what was drawn. A collider would be a common effect, with arrows into shift from both the setting and the defects, the opposite direction from the arrows in this diagram. An instrument would affect the setting and have no arrow of its own into defects; this diagram draws that arrow, so shift is not an instrument. Exam caveat: the graph records assumptions the team must be willing to defend, and it does not by itself measure the size of the effect. Operational check: write the back-door as setting, then shift, then defects, and confirm the analysis conditions on shift without deleting the direct arrow from setting to defects.