
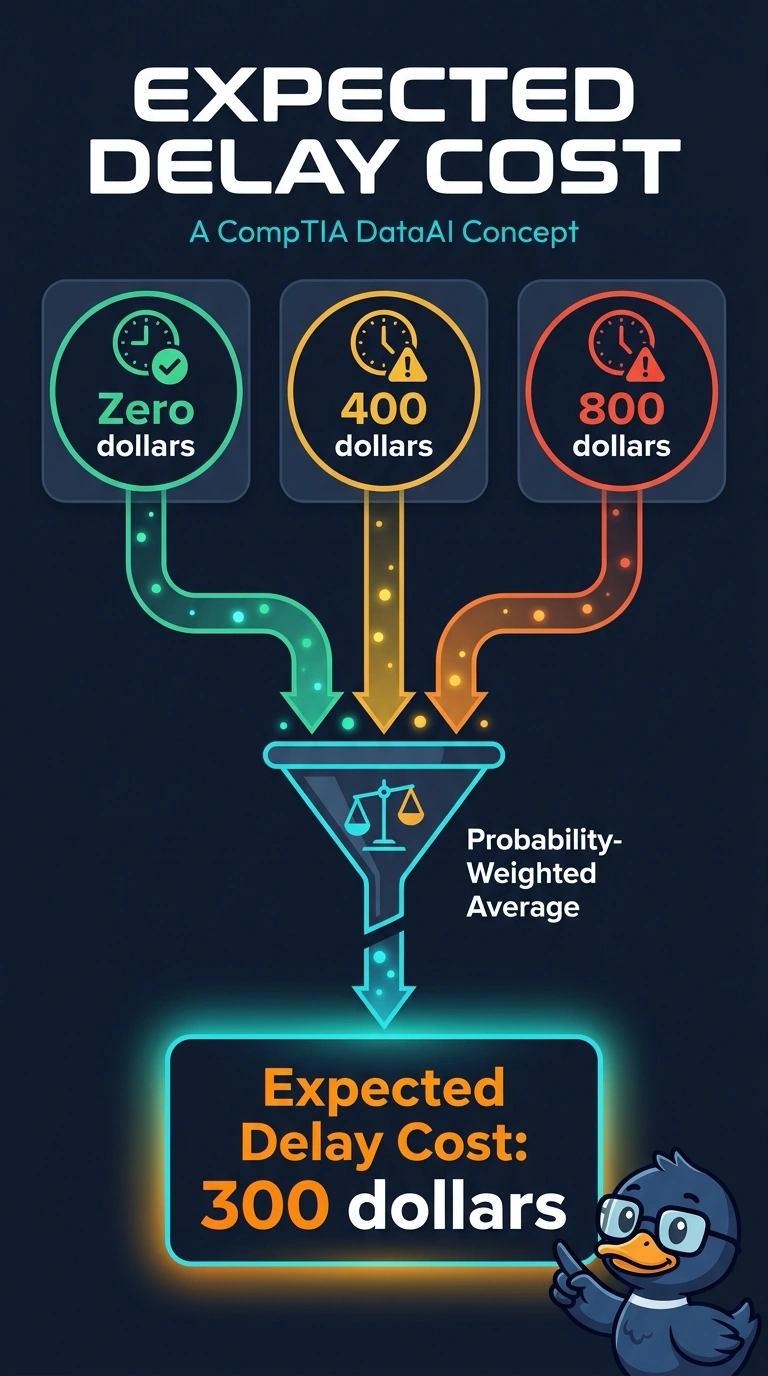
A logistics desk faces a delay cost of zero dollars with probability one half, 400 dollars with probability one quarter, and 800 dollars with probability one quarter. Which figure is the expected delay cost?
Select an answer to reveal the explanation.
Short Explanation
Expected value is the long-run average you would see if this route repeated, with each cost counted in proportion to how often it hits. You weight the costs by their probabilities and add. The biggest penalty, or the sticker prices added together, skips that weighting.
Full Explanation
Expected value multiplies each outcome by its probability and adds the products. One half of zero dollars is zero, one quarter of 400 dollars is 100 dollars, and one quarter of 800 dollars is 200 dollars. Those products sum to 300 dollars, and the probabilities themselves sum to one, so 300 dollars is the probability-weighted average. The unweighted mean of zero, 400, and 800 is 400 dollars, which pretends the three amounts are equally likely even though no charge happens half the time. Taking 800 dollars treats the worst penalty as typical, but that penalty has probability only one quarter. Adding the three amounts to get 1200 dollars counts each penalty as certain and ignores probability entirely. Exam caveat: expected value is not the most common outcome and not the maximum; a route can have an expected cost of 300 dollars while the single most likely cost is zero. Operational check: recompute one half times zero, plus one quarter times 400, plus one quarter times 800, and confirm the total is 300 before anyone quotes a different figure.