
A hospital compares two length-of-stay distributions that share the same mean and the same variance. One has a sharp center with thin tails, and the other has a flatter center with more extreme stays. Which statistic captures that this difference is about tail weight rather than only a peaked middle?
Select an answer to reveal the explanation.
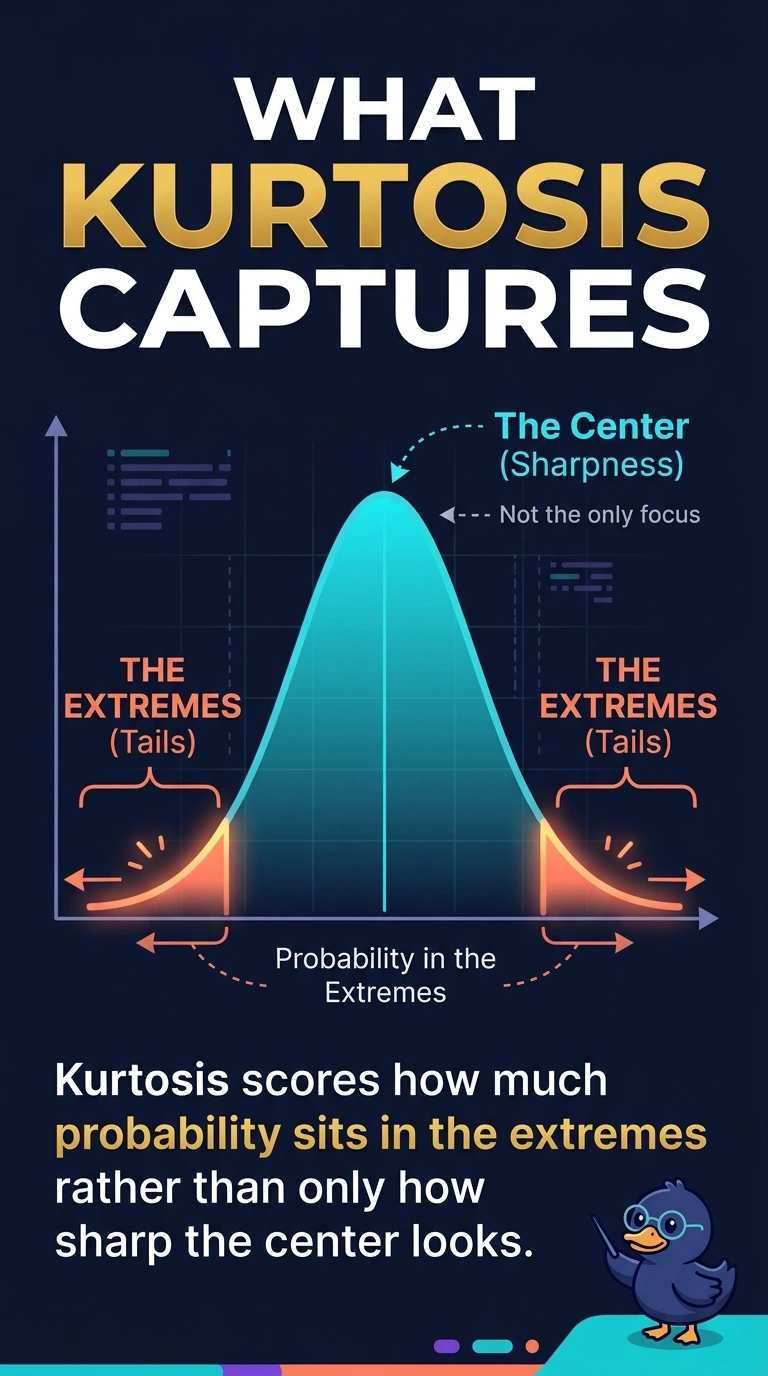
Short Explanation
Two hills can share a height and a width while one spreads into long foothills and the other drops off fast. Kurtosis is how you describe that tail weight, even when the middle looks like the whole story. The trap is treating a matched mean and variance as proof the shapes match.
Full Explanation
Kurtosis summarizes how much probability sits in the tails relative to a reference such as a normal curve with the same variance. Two length-of-stay samples can share a mean and a variance and still differ because one places more probability on extreme stays while the other keeps the remaining mass nearer the center. A higher kurtosis flags those heavier tails. It is not a pure score of how pointed the middle looks, even though older descriptions emphasized peakedness. Skewness compares the tails with each other and flags asymmetry, so equally heavy tails on both sides can leave skewness near zero while kurtosis stays high. Variance is the spread the hospital already matched, so it has no remaining contrast to explain. The arithmetic mean only locates the center and was matched by design, so it cannot describe tail weight. Exam caveat: read the figure against the software's convention, because some tools report excess kurtosis relative to a normal curve and others report the raw moment. Operational check: plot both samples on one scale and compare the share of stays beyond a common extreme cutoff. The heavier-tailed sample should put more stays past that cutoff even though the means and variances match.