
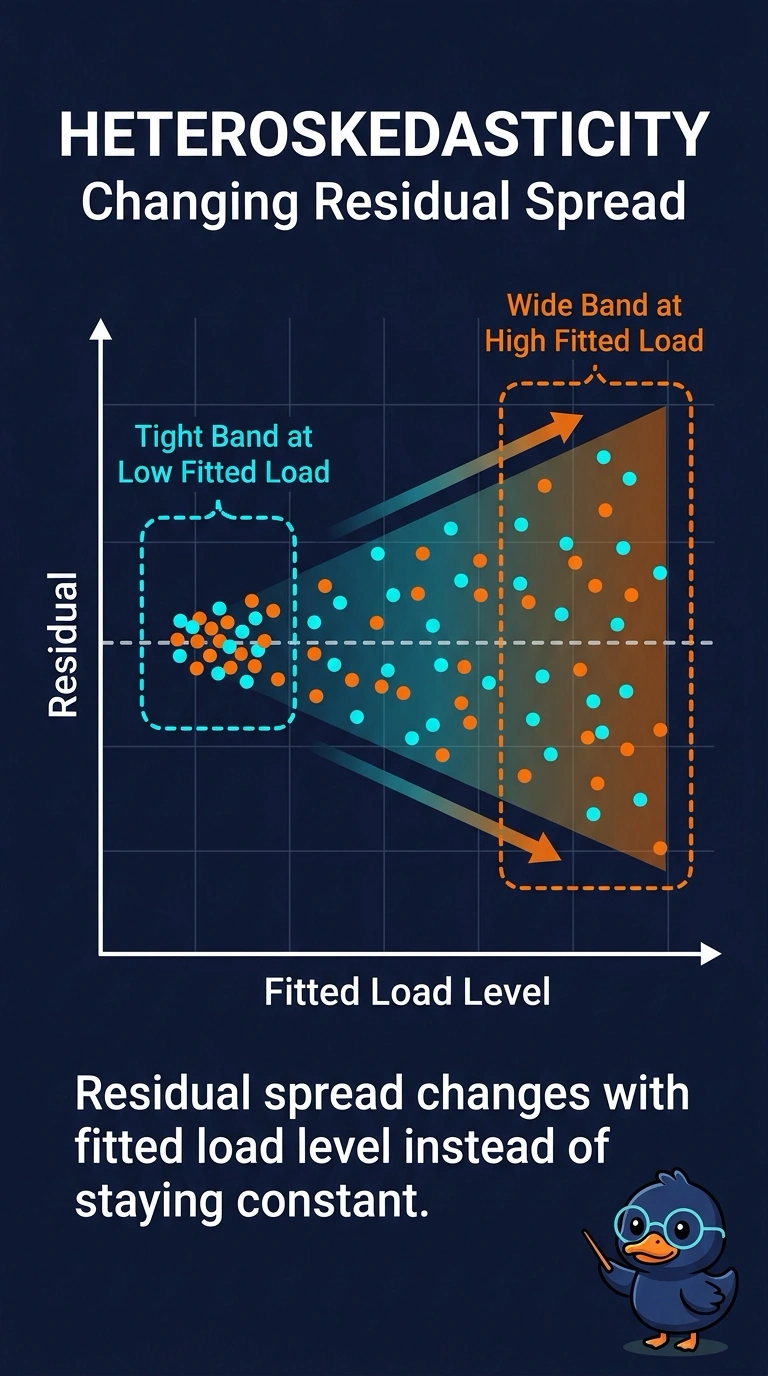
A utility fits a model of hourly electricity load. The residual plot is a tight band at low fitted load and a wide band at high fitted load. What is that pattern called?
Select an answer to reveal the explanation.
Short Explanation
Picture a funnel of residuals: skinny when the fitted load is low and wide when it is high. That changing spread is heteroskedasticity, and it is what you are looking at. A constant-spread label, or a story about predictors moving together, is the trap.
Full Explanation
Heteroskedasticity means the variance of the residuals is not constant. In this load model the residuals form a tight band when the fitted level is low and a wide band when the fitted level is high, so the spread changes with the fitted value. That is the definition of heteroskedasticity, and it matters because inference that assumes constant residual variance can misstate uncertainty even when the fitted mean is reasonable. Homoskedasticity is the opposite pattern: residual spread that stays about the same width across fitted levels, which this plot does not show. Multicollinearity describes predictors that move together and can inflate coefficient uncertainty. It is not a widening residual band. Serial correlation describes residuals that are related across neighboring hours. Dependence over time can exist in hourly load, but it is not the same fact as a spread that grows with the fitted level. Exam caveat: a fan-shaped residual plot is evidence about variance, not automatic proof that the mean equation is wrong. Operational check: split residuals into low and high fitted-load groups and compare their spreads. The high-load group should show the wider spread.