
A streaming service emails one offer to a fixed subscriber list. Each person clicks or does not, independently, with the same chance of clicking. Analysts want a distribution for how many clicks occur in that list. Which distribution matches?
Select an answer to reveal the explanation.
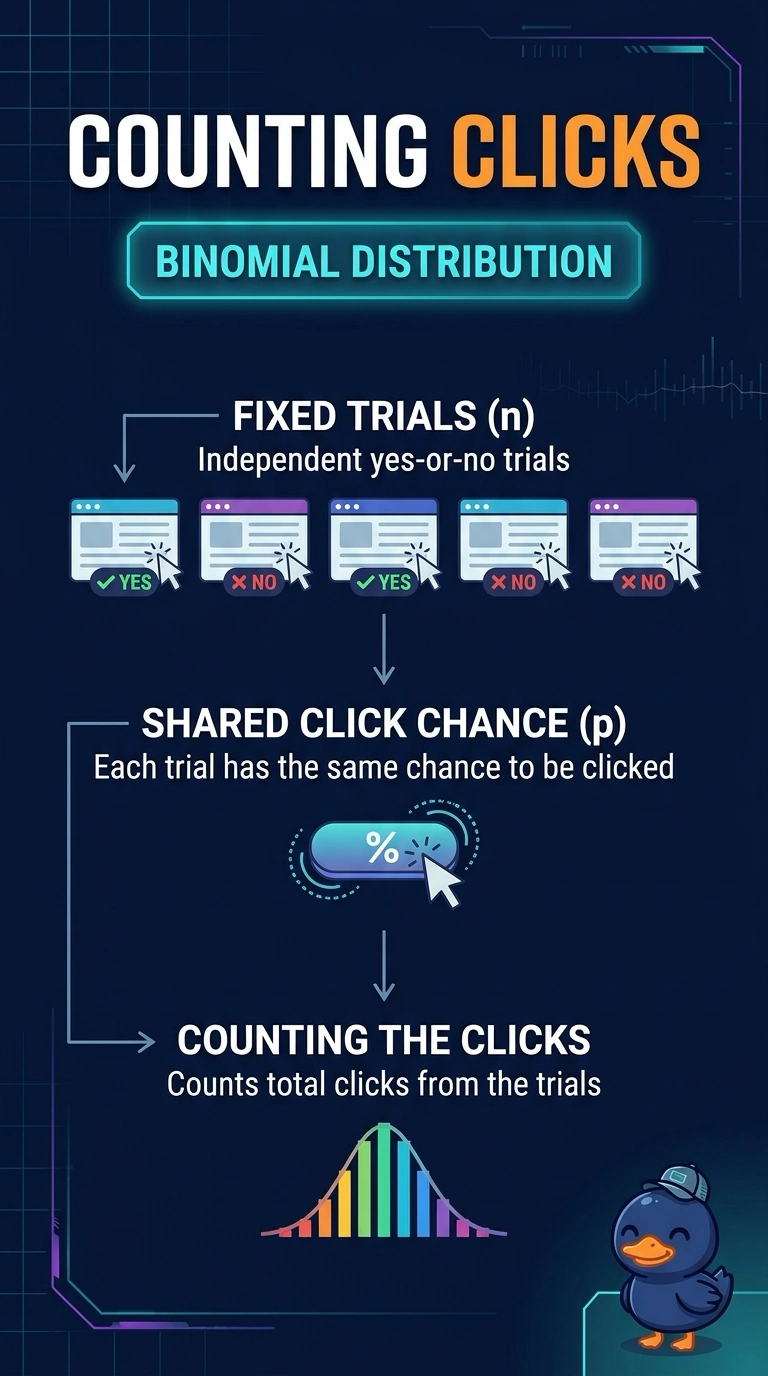
Short Explanation
A fixed guest list where each person either shows up or does not is a stack of coin flips, not a rare-event counter. The binomial distribution counts those clicks across your preset trials with one shared chance. The trap is the Poisson, which belongs to a window that has no fixed trial count.
Full Explanation
A binomial distribution counts the number of successes in a fixed number of independent trials that each have the same success probability and two outcomes. The subscriber list is that fixed trial count, each person clicks or does not, the trials are independent, and the click chance is shared, so the number of clicks is binomial. A Poisson distribution counts events in a window when there is no preset number of trials; using it here drops the fixed list the stem made central. A normal distribution describes a continuous symmetric measurement, not a count of yes-or-no clicks, even though a large list can make the binomial shape look bell-like. A geometric distribution counts the trials until the first success, which answers how many emails until the first click, not how many clicks the full list produced. Exam caveat: a bell-shaped histogram of click totals does not replace the process description; fixed trials, two outcomes, independence, and one shared chance identify the binomial. Operational check: confirm each campaign has a known list size, each row is one subscriber with a click or no click, and the modeled value is the sum of those clicks.