
A grant-making agency plots award amounts. Most awards are small, a handful are enormous, and the histogram shows a long right tail instead of a symmetric bell. Which description matches that shape?
Select an answer to reveal the explanation.
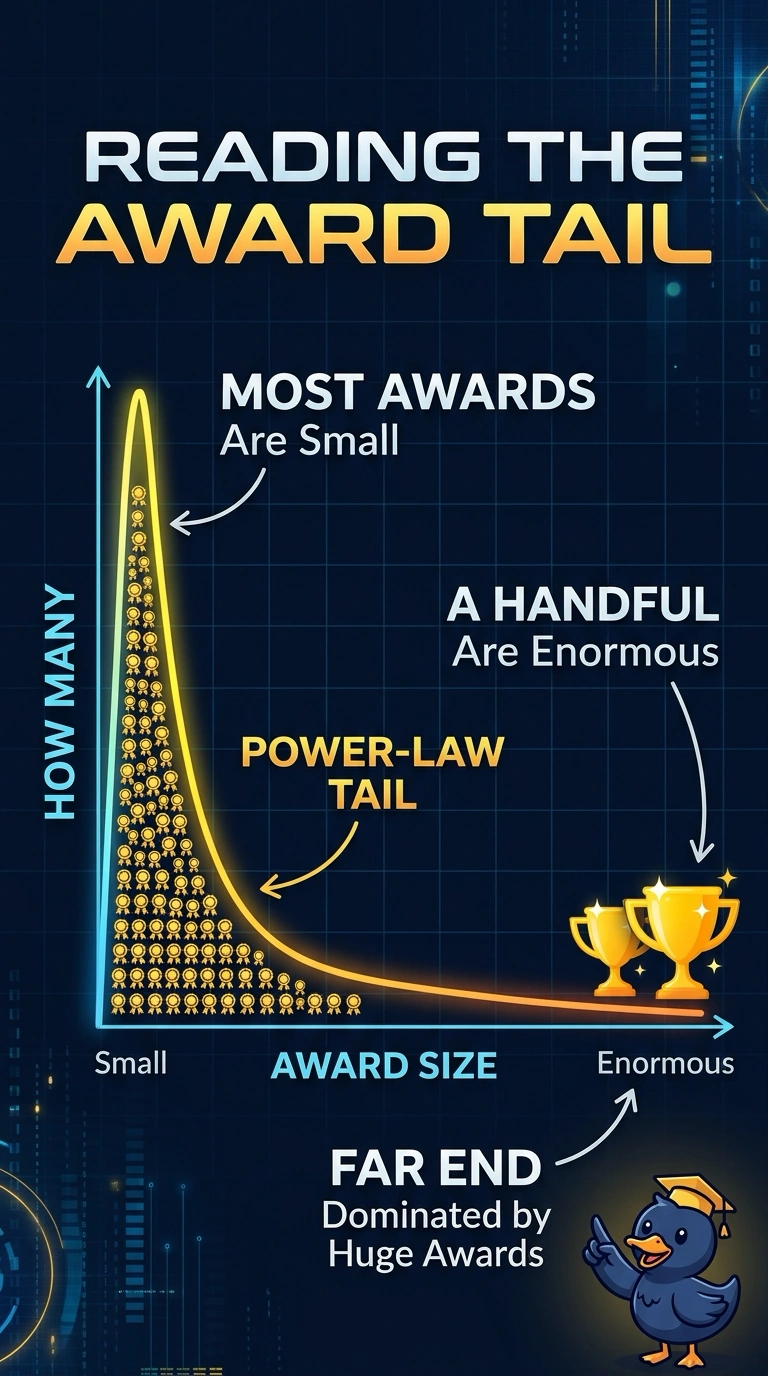
Short Explanation
Picture a town with many cottages and a few skyscrapers: lots of small values, then a handful of giants. That long heavy tail is the power-law shape you are looking at in the grant amounts. The trap is calling it a normal bell, which would pile awards up symmetrically around a typical size.
Full Explanation
A power-law tail is a shape with many small values and a few huge ones, so the far right of the distribution carries a handful of enormous observations rather than thinning quickly. The grant histogram, mostly small awards plus a few giants and no symmetric bell, matches that description. A normal distribution clusters values symmetrically around a typical amount and has thin tails on both sides, which is the shape this plot does not show. A binomial count comes from a fixed number of yes-or-no trials and peaks near an expected number of successes; award amounts are not that kind of trial tally. A uniform distribution makes every amount in a range about equally common, so it has no small-heavy body and no handful of enormous awards. A symmetric mound with thin tails is a different shape, even when a few awards sit somewhat above the center. Exam caveat: other heavy-tailed shapes can look similar on a quick histogram, so the many-small, few-huge pattern should be checked before the tail is named. Operational check: plot the award histogram and a log-log view of the upper tail, and confirm the mass sits at small awards with a sparse run of huge ones.