
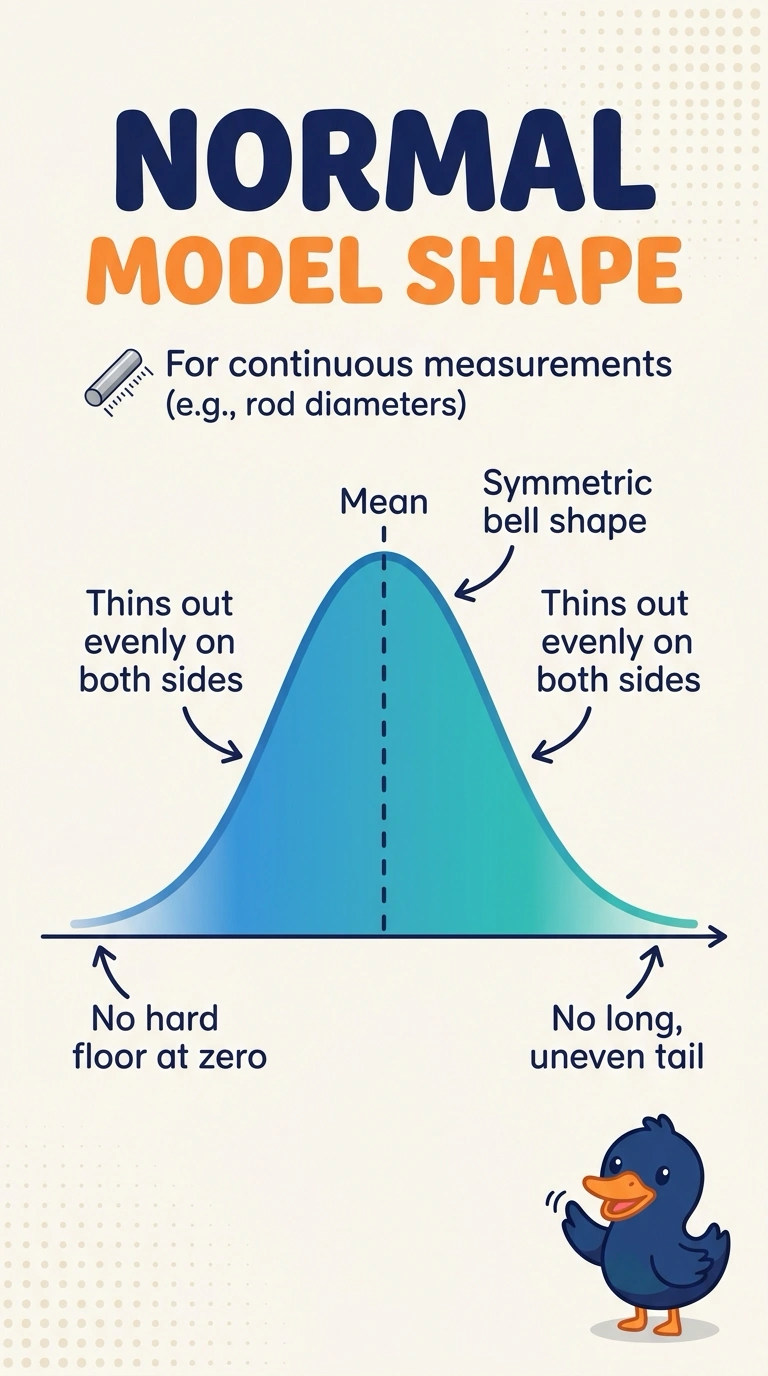
A factory records rod diameters. The values pile up symmetrically around the mean diameter and thin out evenly on both sides, with no hard floor at zero and no long tail of rare huge readings. Which probability model matches that shape?
Select an answer to reveal the explanation.
Short Explanation
A stack of rods that is thickest in the middle and thins evenly to both sides is a bell, and that is the shape you model with a normal distribution. Poisson counts and binomial trial counts are built for whole-number events, and a power-law pile leans into a long tail. The trap is reaching for a count model just because the histogram has one peak.
Full Explanation
A normal model describes a continuous measurement whose density is symmetric about the mean and thins evenly in both tails. Rod diameters that pile up around the mean, with no hard floor at zero and no long one-sided tail, match that shape. A Poisson model is a count distribution for the number of events in an interval; its support is the non-negative integers, not a continuous diameter. A binomial model counts successes in a fixed number of yes-or-no trials and is likewise a discrete count, not a symmetric continuous measurement. A power-law model concentrates on small values and stretches a heavy tail toward rare extremes, which is the opposite of even thinning on both sides. Exam caveat: a single peaked histogram is not enough to name the model; symmetry, continuous measurements, and the absence of a long one-sided tail are what select the normal shape here. Operational check: plot the diameters, confirm one peak at the mean with both tails thinning similarly, and confirm the values are continuous measurements rather than event counts.