
An agency stores dozens of correlated economic indicators and wants fewer uncorrelated directions that preserve as much of the spread as possible, then use those directions as inputs to a linear model. Which method produces the directions?
Select an answer to reveal the explanation.
Short Explanation
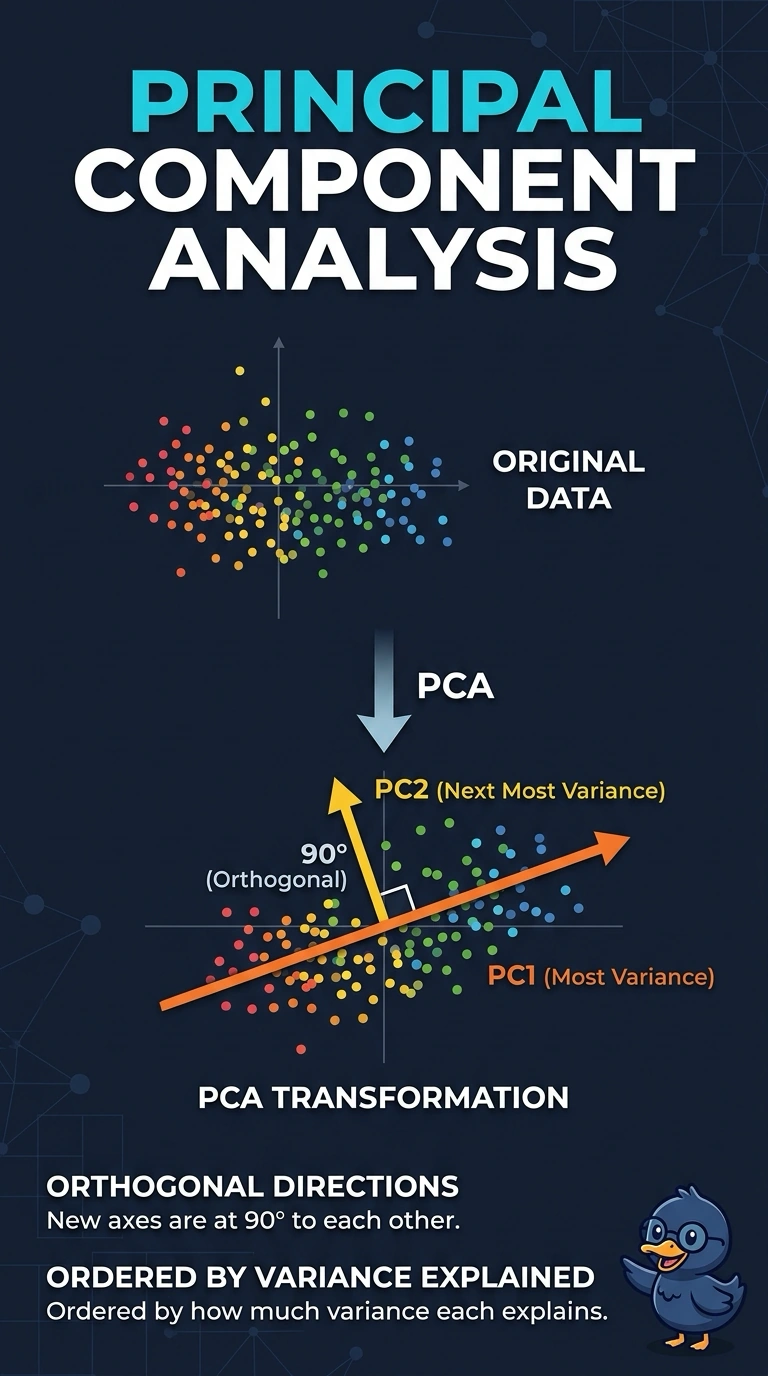
Turn the view until the widest spreads in the indicator cloud line up with the axes. You want principal component analysis, orthogonal directions ordered by variance, which you can hand to a later linear model. The trap is a neighbor picture that was drawn only to be looked at.
Full Explanation
Principal component analysis rotates correlated indicators into orthogonal directions and orders those directions by the variance each one explains. The same rotation can be applied to a later row, so the directions are usable inputs to a linear model, and they are uncorrelated by construction. t-SNE draws a two-dimensional neighbor map for looking at who sits near whom, and that picture is not a variance rotation to pass into the model. DBSCAN forms dense groups and can label sparse points as noise; it does not build axes ranked by spread. A nearest-neighbor vote assigns a label to a new record from already labeled neighbors and does not rotate the indicator columns at all. Exam caveat: the directions come out ordered by variance, and the team still chooses how many leading ones to keep; there is no universal cutoff. Operational check: confirm the retained directions are uncorrelated and ordered by decreasing variance, and that a new indicator row can be projected with the stored rotation before it enters the linear model.