
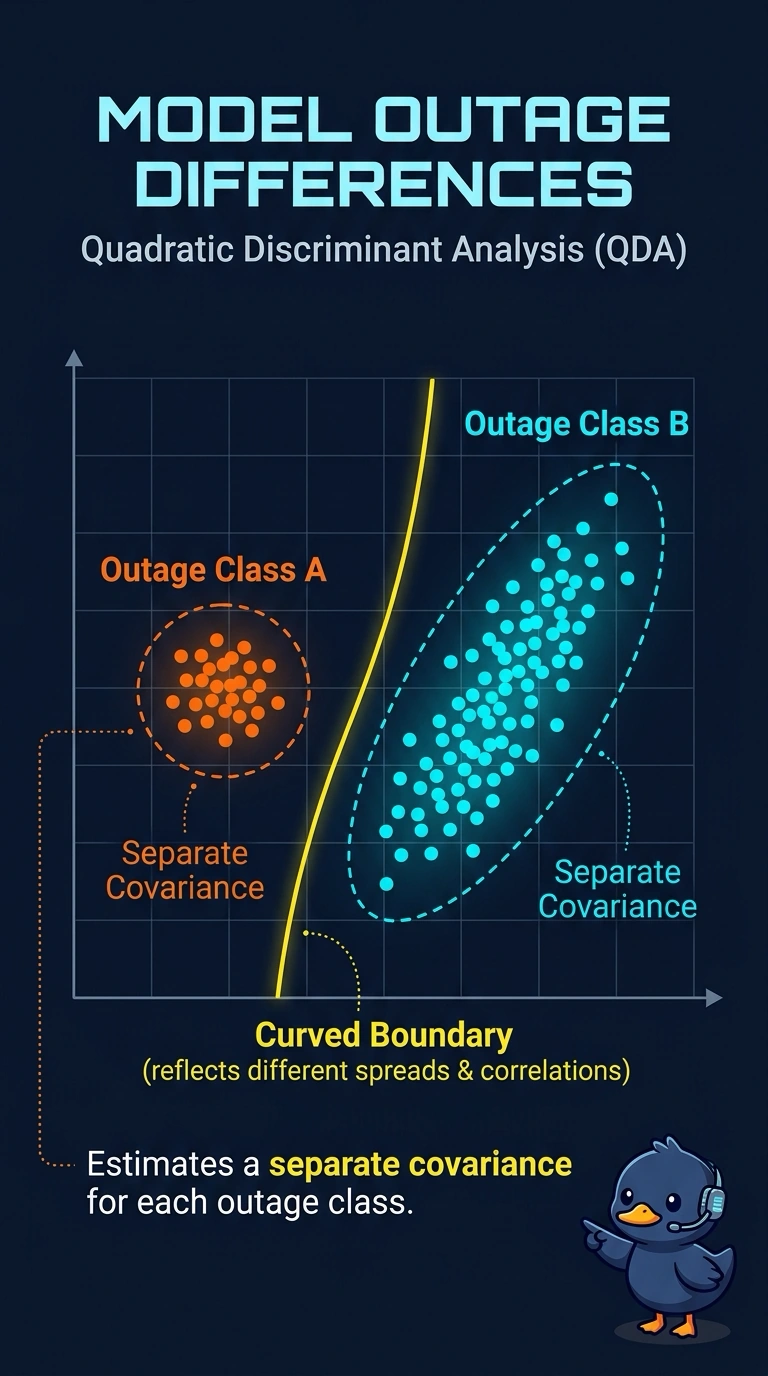
An electric utility wants a classifier that estimates a separate covariance for storm-related outages and for equipment-related outages, because spread and correlation differ by class. Which method estimates those separate covariances?
Select an answer to reveal the explanation.
Short Explanation
If two clouds of outages are different shapes, one shared rubber stamp will not trace both of them. Quadratic discriminant analysis estimates a separate covariance for each class, which is the difference you found between storm and equipment outages. The trap is linear discriminant analysis, which forces both classes to share one covariance.
Full Explanation
Quadratic discriminant analysis models each class with its own covariance. Spread and correlation are estimated separately for storm-related outages and for equipment-related outages, so the boundary between classes can curve when those shapes differ. That is the method the utility described. Linear discriminant analysis pools the classes into one shared covariance and separates them by their centers, which is the assumption this data violated. Naive Bayes goes further in the other direction: it multiplies per-feature likelihoods and treats features as independent given the class, so it does not estimate a full covariance for either outage type. Logistic regression models the log-odds of the class from the features directly and does not estimate a class-conditional covariance at all, even though it can still be used as a two-class classifier. Exam caveat: separate covariances need enough rows in each class to estimate those matrices; a class with very few outages cannot support a rich quadratic fit. Operational check: estimate a covariance matrix inside each outage class and confirm the correlations differ before committing to quadratic discriminant analysis.