
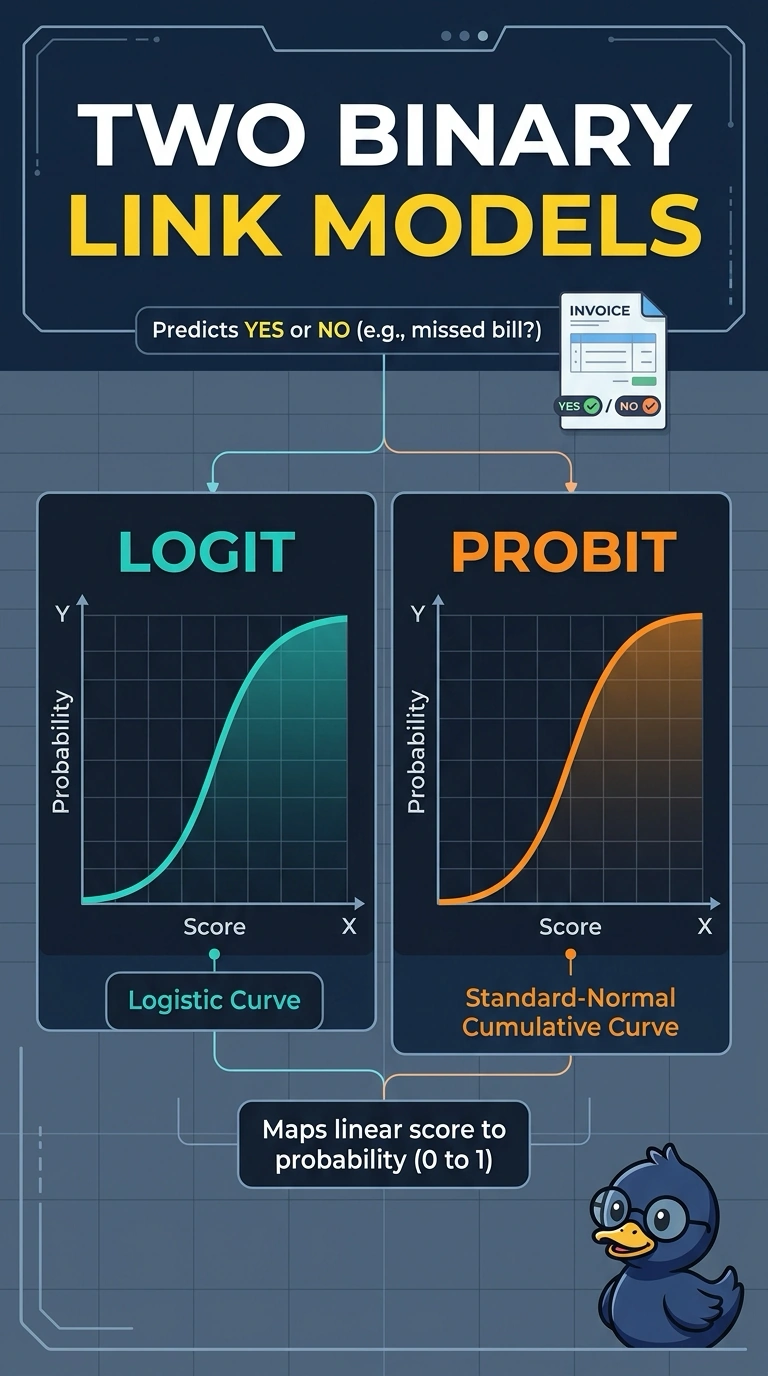
A utility models whether a customer misses a bill, and the outcome is yes or no. One candidate maps the linear score to a probability with a logistic link, and the other maps that score with a standard-normal cumulative link. Which statement describes the two models?
Select an answer to reveal the explanation.
Short Explanation
Two doors can open into the same yes-or-no room and still have different frames you can tell apart. Logit and probit are both binary models for a missed bill, and they differ in the link that turns the linear score into a probability. The trap is treating probit as ordinary least squares, or as a model for a dollar amount.
Full Explanation
Logit and probit are both models for a binary outcome. Logit uses a logistic link, so the missed-bill probability follows a logistic curve in the linear score. Probit uses the cumulative distribution function of a standard normal, so the same score is mapped through a normal curve instead. Both keep a yes-or-no probability, and the link shape is the difference. Treating the normal link as ordinary least squares confuses a binary probit model with an unbounded linear fit. Treating the two links as the same logistic curve erases the normal cumulative function that defines probit. Treating probit as a count of missed bills and logit as a dollar amount replaces the yes-or-no outcome with two different numeric outcomes neither candidate is using. Exam caveat: the two links often agree in the middle of the probability range and differ more in the tails; the modeling point is that the links are different, not that one is universally preferred. Operational check: plot both link curves against the same linear score and confirm one is the logistic curve and the other is the standard-normal cumulative curve, both staying between zero and one.