
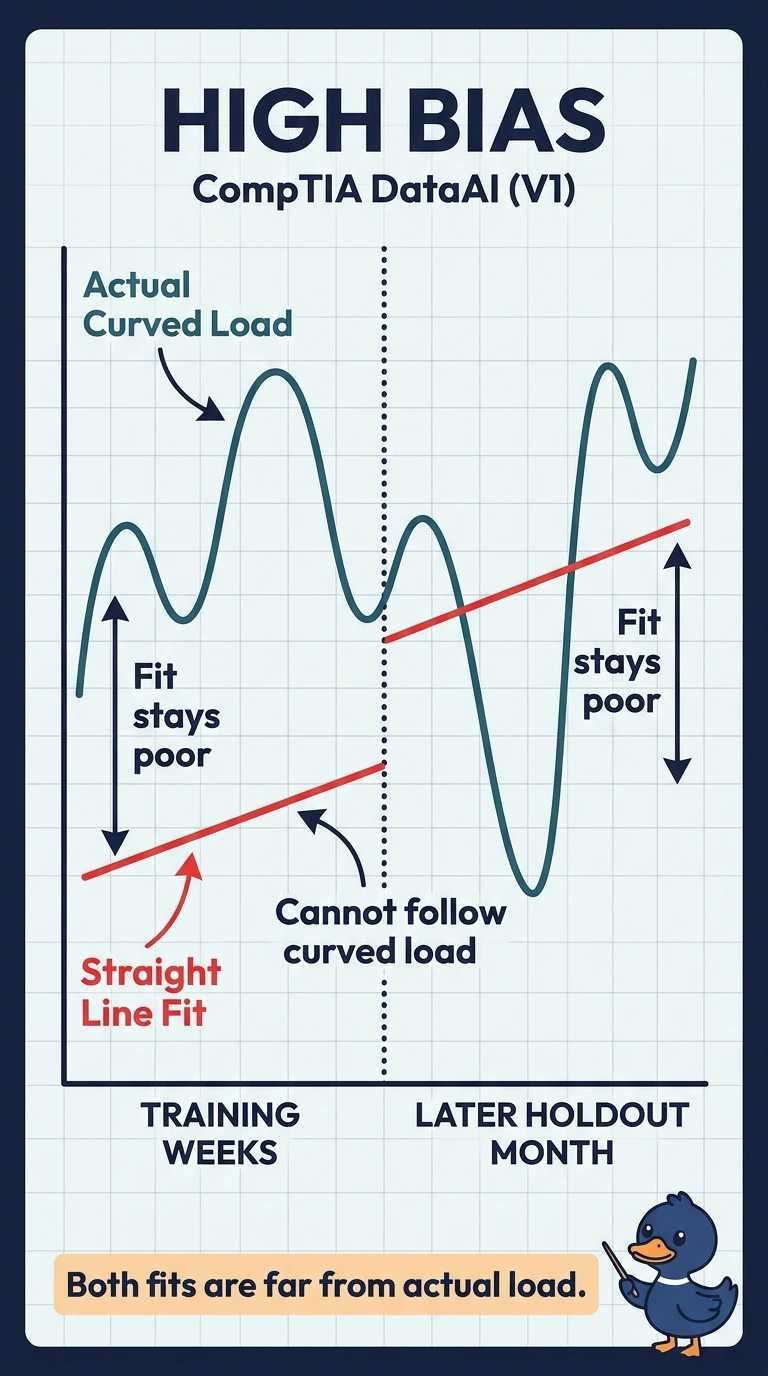
A utility outage model stays far from its training weeks and equally far from a later holdout month. The form is a straight line through a clearly curved load pattern. Which problem is that?
Select an answer to reveal the explanation.
Short Explanation
A rigid ruler laid across a curved road misses the road on every block, not just the next one. You are seeing high bias: the straight line fits the training weeks poorly and stays poor on the later month. The trap is calling it high variance, which would fit the training weeks closely before failing later.
Full Explanation
High bias is underfitting: the model’s form is too limited to represent the pattern, so error stays high on both the training data and later data. A straight line cannot follow a clearly curved load pattern, which explains why the outage model is far from the training weeks and equally far from the holdout month. High variance does not fit this pattern: a model that memorizes noise typically fits its training weeks closely, then performs poorly on new weeks, creating a gap between training and holdout performance. Preprocessor leakage from fitting a scaler on the full table can make a holdout score look better than an honest score; it does not explain a poor fit on both the training weeks and the later month. Holdout-only label noise would leave the training fit intact and corrupt only the later month’s outage labels, unlike the poor fit on both sets described here. Exam caveat: high bias refers to a model form that is too rigid for the underlying curve, not to bias in how the weeks were sampled. Practical check: plot fitted values against the load in the training weeks; systematic misses along the curve suggest adding flexibility before investigating variance or data issues.