
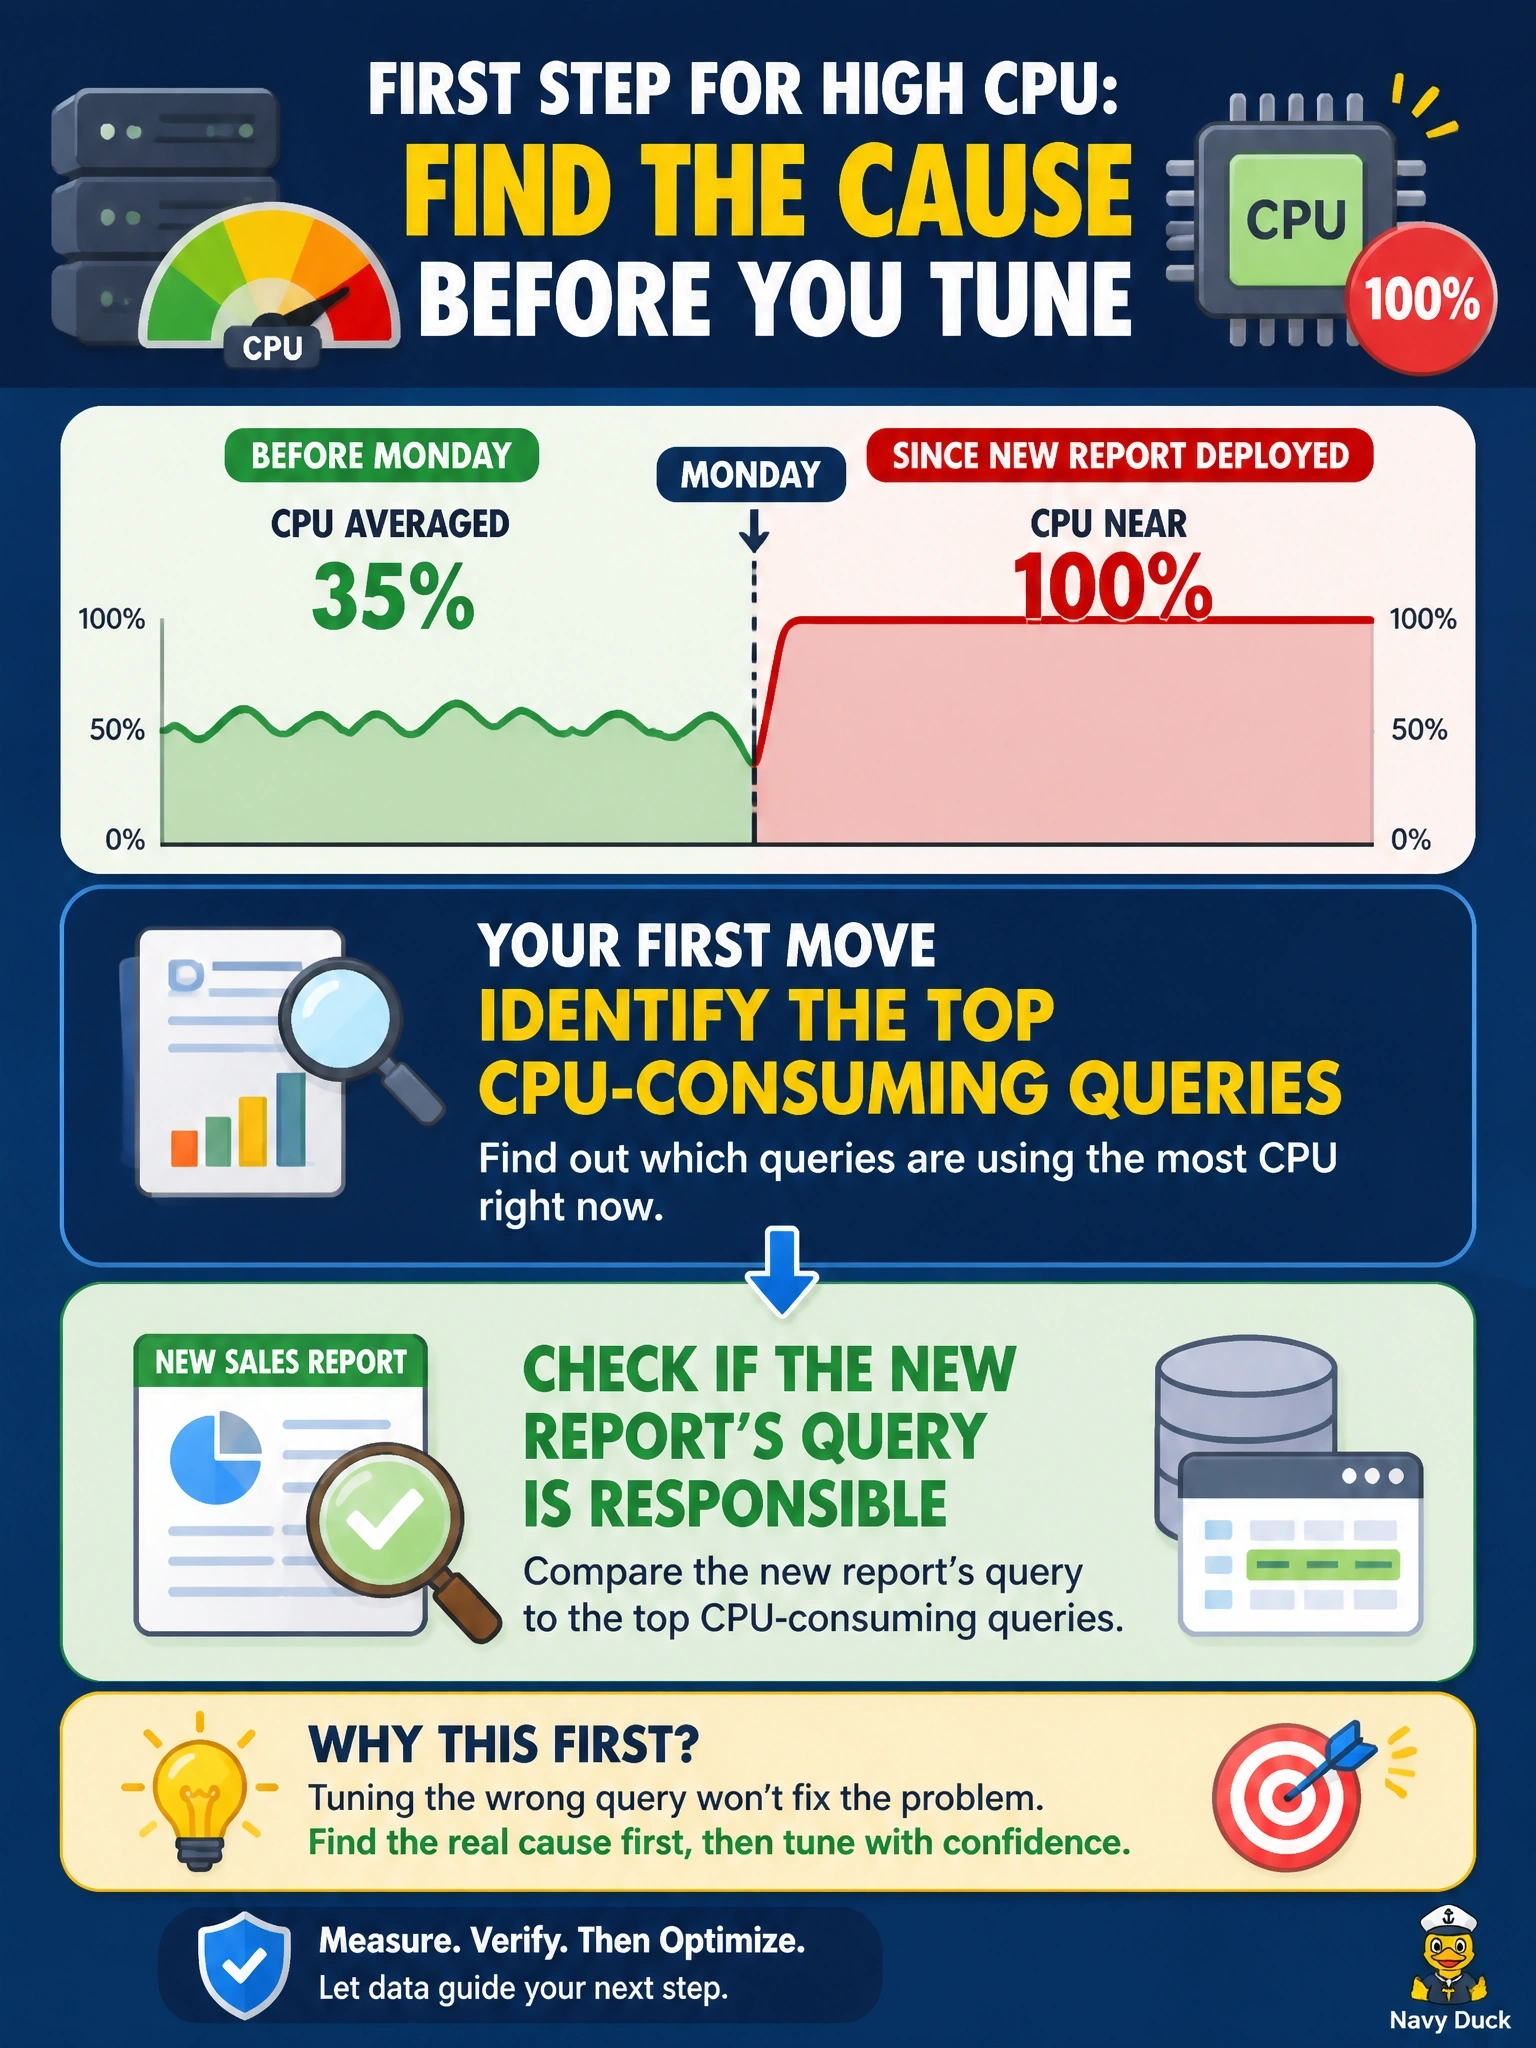
CPU utilization on a database server has stayed near 100 percent since a new sales report was deployed on Monday. Before Monday, CPU averaged 35 percent. What should the DBA do first?
Select an answer to reveal the explanation.
Short Explanation
If the electric bill triples the week you bought a space heater, you check the space heater before rewiring the house. The timing of your CPU spike points straight at the new report, so you confirm it with the top-query list and tune what you find. Throwing hardware at it first just pays for the bad query's habit.
Full Explanation
A sustained CPU increase that begins with a specific deployment should be investigated by correlating resource use with the workload. Database engines expose statistics on the queries consuming the most CPU, and monitoring tools can rank queries by total and average CPU time. If the new report's query is at the top, the DBA can examine its execution plan for problems such as missing indexes, large scans, implicit conversions or excessive sorting, then tune the query or schedule the report off-peak. Adding processor cores treats the symptom without diagnosis; if one inefficient query is responsible, extra cores are an expensive and possibly temporary fix, and the query may consume them as well. Restarting the service nightly clears caches and kills sessions but does nothing about a query that runs again the next day; it also causes outages and discards cached plans and data, which raises CPU temporarily. Disabling automatic statistics updates degrades optimizer decisions over time, which tends to produce worse plans and more CPU use, not less. Exam caveat: correlating a change in resource use with recent changes is a standard troubleshooting step and links monitoring to change management records. Operational check: capture top queries by CPU before and after the deployment, review the report query's plan, apply a fix in non-production, and verify CPU returns toward the 35 percent baseline.