
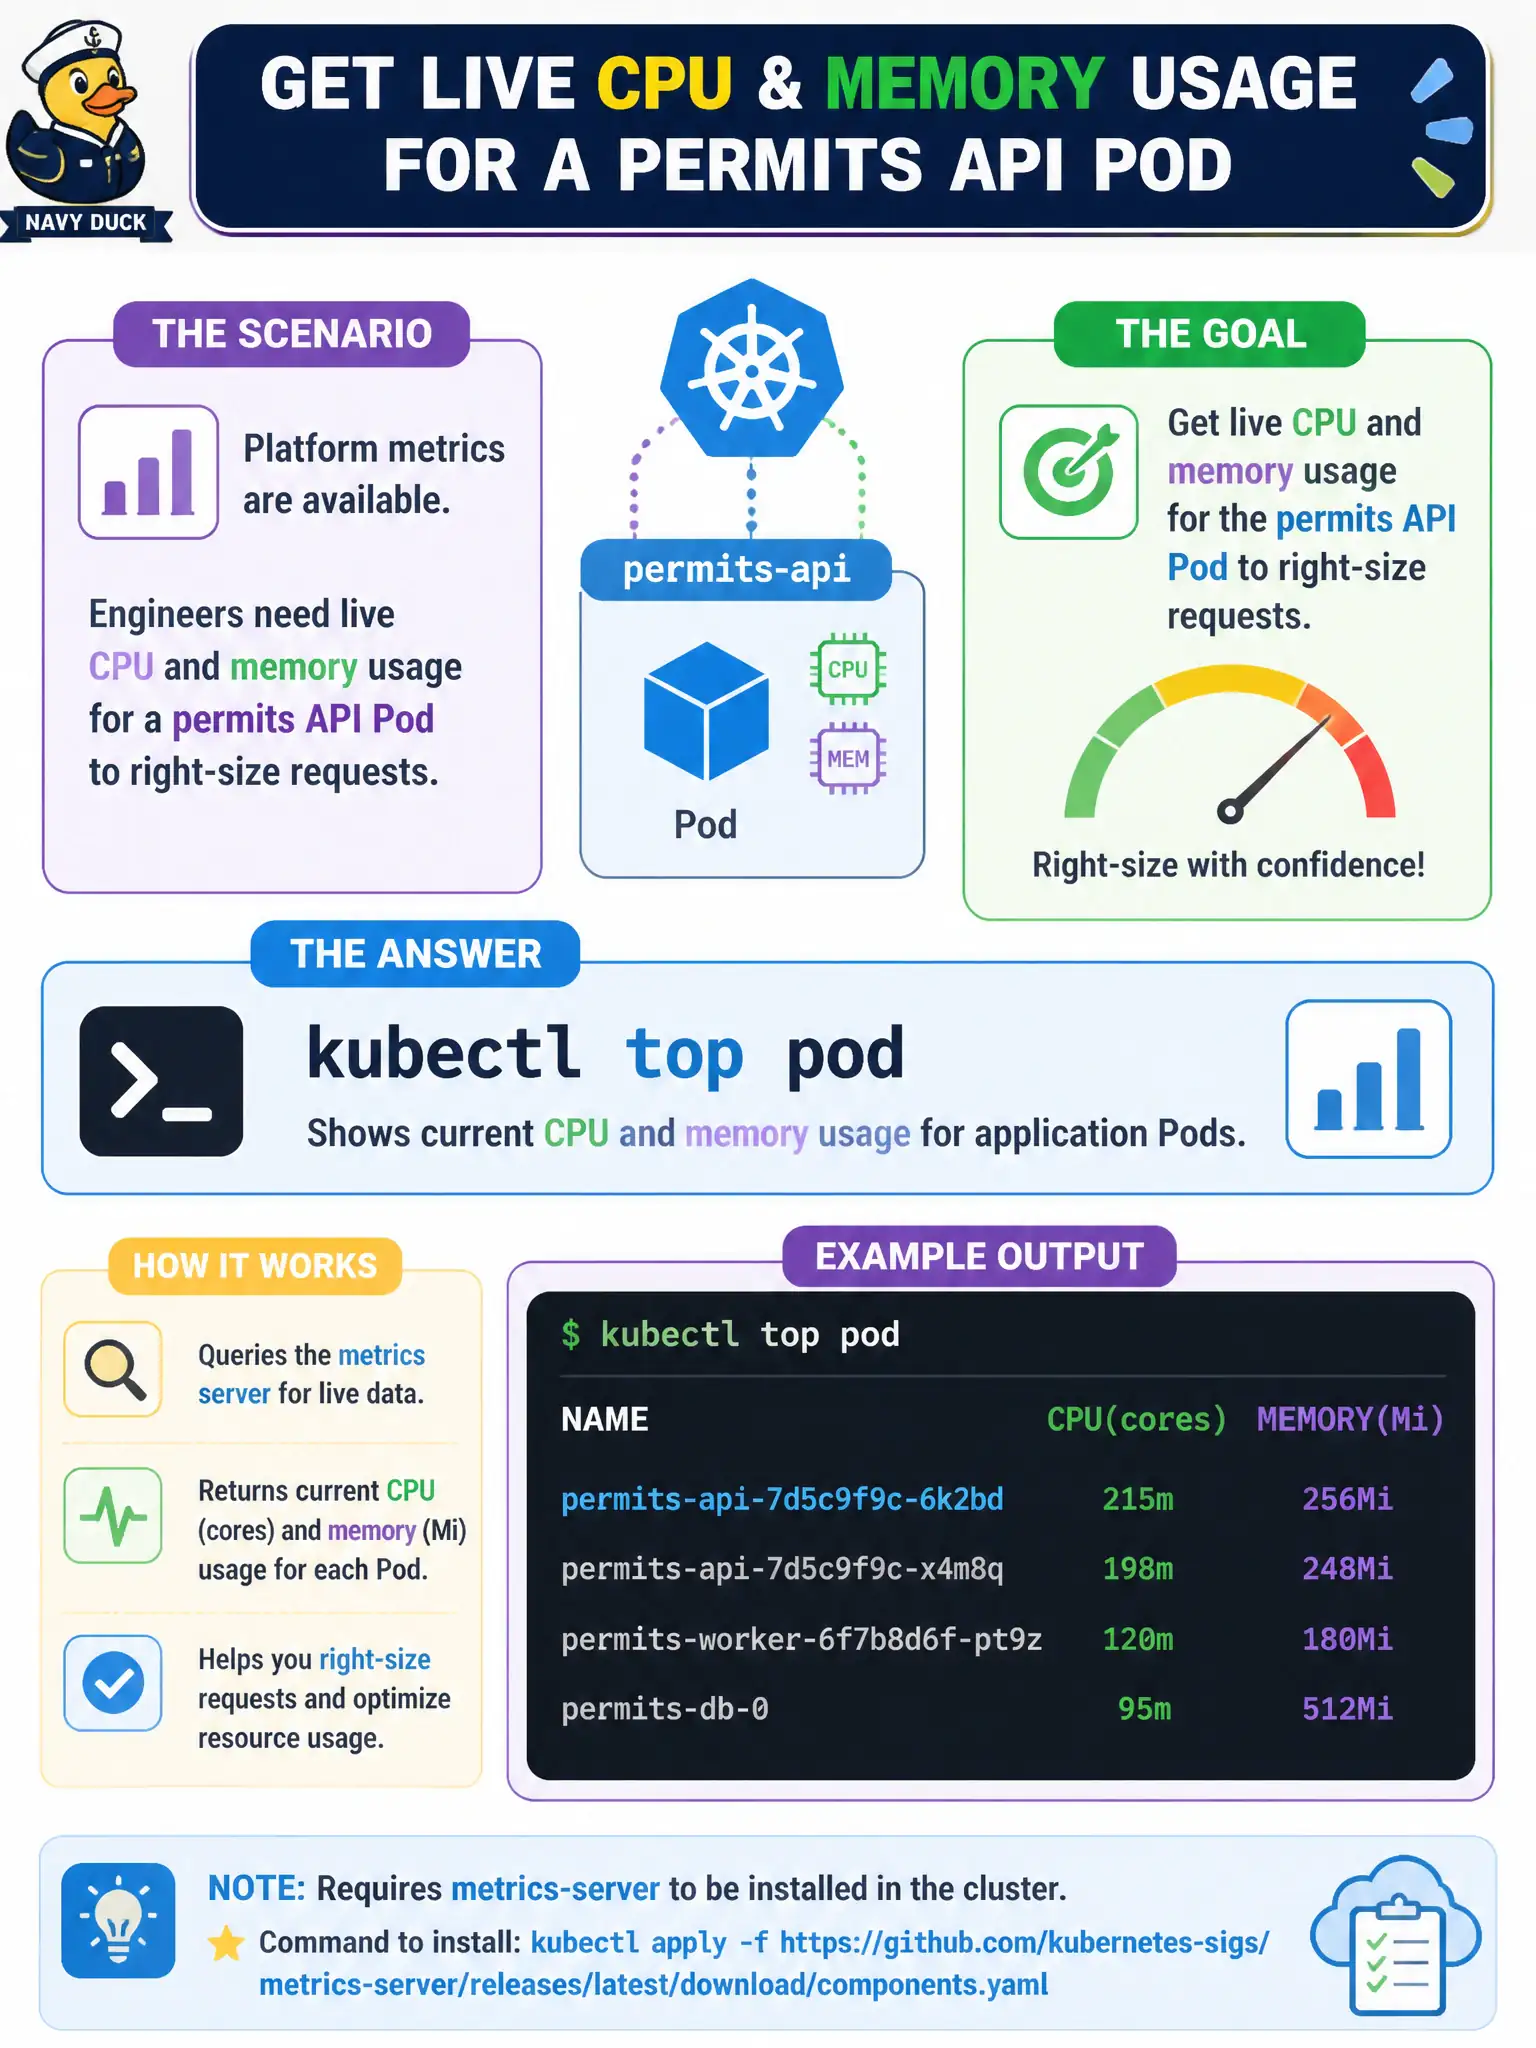
Platform metrics are available. Engineers need live CPU and memory usage for a permits API Pod to right-size requests. Which built-in CLI command helps?
Select an answer to reveal the explanation.
Short Explanation
Right-sizing starts with ‘what’s it actually using?’ kubectl top pod (with metrics available) shows live CPU and memory for your app Pods. That beats guessing from a one-off free or reading only the explain docs.
Full Explanation
When platform metrics are available and engineers need live CPU and memory usage for a permits API Pod to right-size requests, kubectl top pod shows current usage for application Pods via the Metrics Server. That built-in CLI view supports municipal capacity conversations with a fast, consistent signal—far better than ad-hoc exec experiments when deciding whether the permits API’s requests are too low (throttling/Pending risk) or too high (waste on the city cluster).
Why the other options fail by concept: kubectl exec into the Pod only to run free once ignores Metrics Server, does not scale to many replicas, and is awkward for fleet right-sizing. kubectl explain pods.spec.containers.resources documents the schema but provides no live data. kubectl cordon every node to force usage to zero is destructive, harms scheduling for other civic workloads, and does not measure normal permits traffic.
Exam caveat: Metrics Server must be installed and healthy; otherwise top fails. top shows usage samples, not full throttling detail—pair with requests/limits and describe for CPU throttling signals. Right-sizing for municipal APIs should consider peak load tests, not only idle midday snapshots, and should leave headroom for rolling surges.
Operational check: kubectl top pod -n <permits-ns> -l app=permits-api, compare numbers to kubectl get pod -o yaml requests/limits, adjust requests with a documented safety margin, roll the Deployment, and re-check top under representative load before locking the values in Git.