
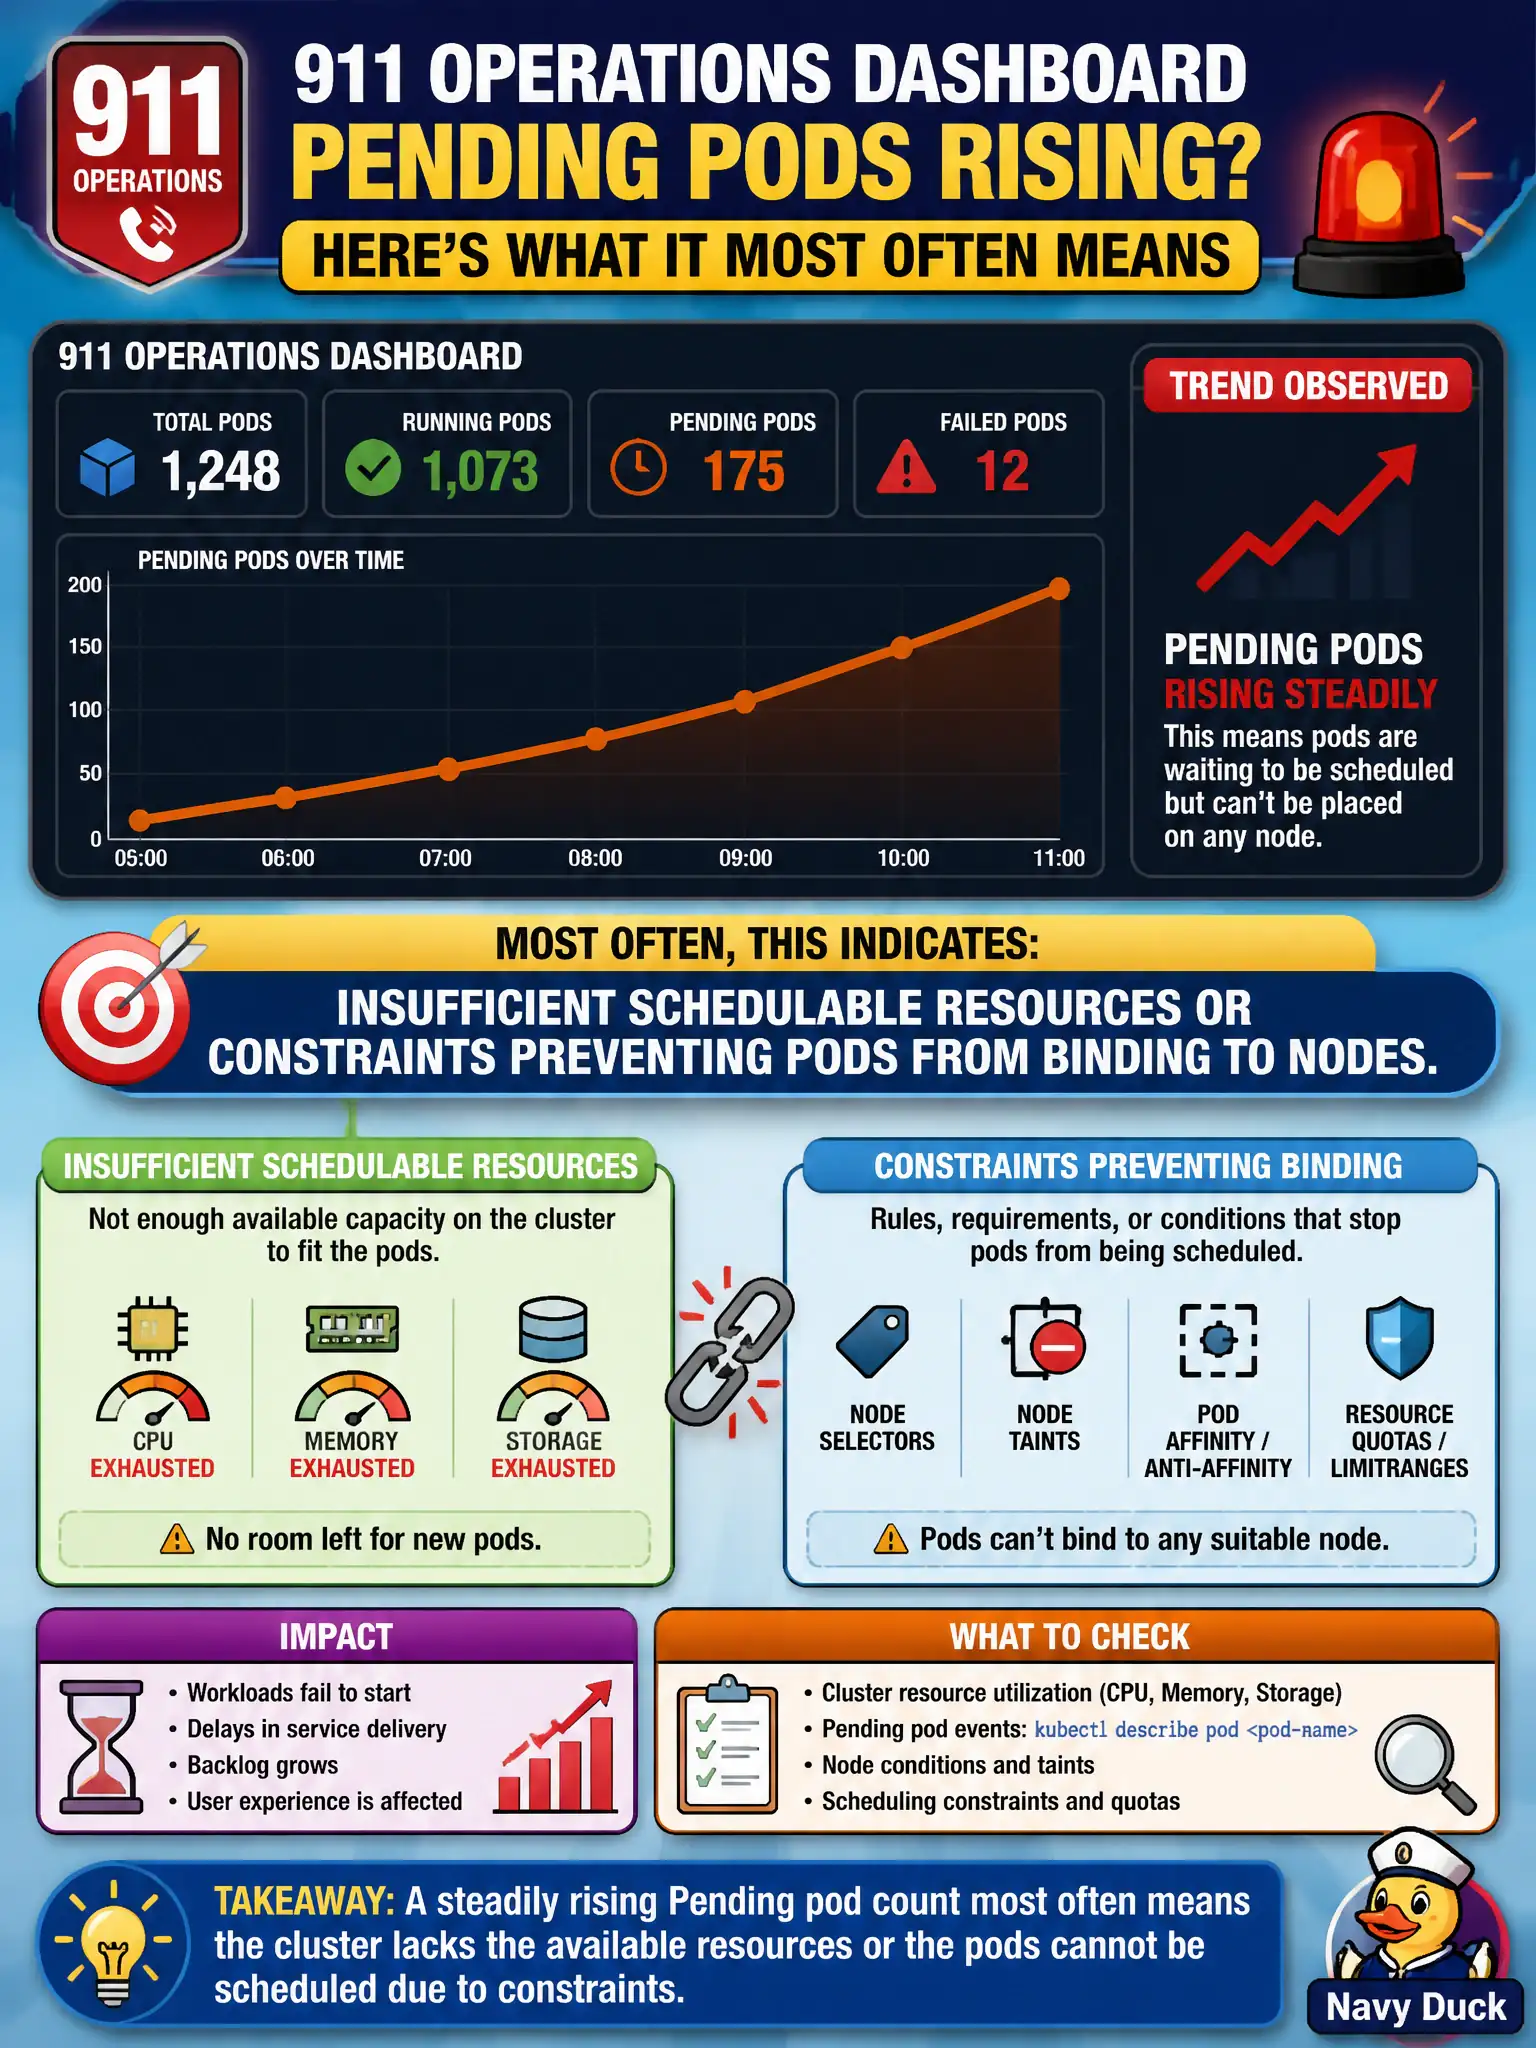
A 911 operations dashboard shows the count of Pending pods rising steadily. What does that trend most often indicate?
Select an answer to reveal the explanation.
Short Explanation
Pending means the scheduler has not found a home yet—usually the cluster is short on room or the pod asks for something no node can give. Rising Pending is a capacity red flag.
Full Explanation
A steadily rising count of Pending pods on a 911 operations dashboard most often indicates insufficient schedulable resources or scheduling constraints preventing pods from binding to nodes—CPU or memory fit failures, taints without tolerations, affinity rules, PVC constraints, or similar blockers. Pending means the scheduler has not yet found an acceptable home for those pods, so capacity and constraints should be first-line suspects. The trend does not indicate successful completion of all Jobs in the cluster; completed Jobs move pods toward Succeeded rather than accumulating as Pending placements. It does not mean every Service has switched to externalTrafficPolicy Local; that Service field affects how external traffic prefers local endpoints, not whether new pods remain Pending. It does not mean metrics-server is scraping too frequently; metrics scrape intervals are unrelated to the scheduler’s ability to bind pods onto nodes. Exam caveat: Always read FailedScheduling events for the precise predicate. Distinguish pure capacity exhaustion from “capacity exists but taints, selectors, or topology rules block every node,” both of which present as Pending. Operational check: Describe representative Pending pods, aggregate the failure messages, free or add node capacity, adjust requests or taints and tolerations, and watch the 911 Pending count fall as pods become Running.