
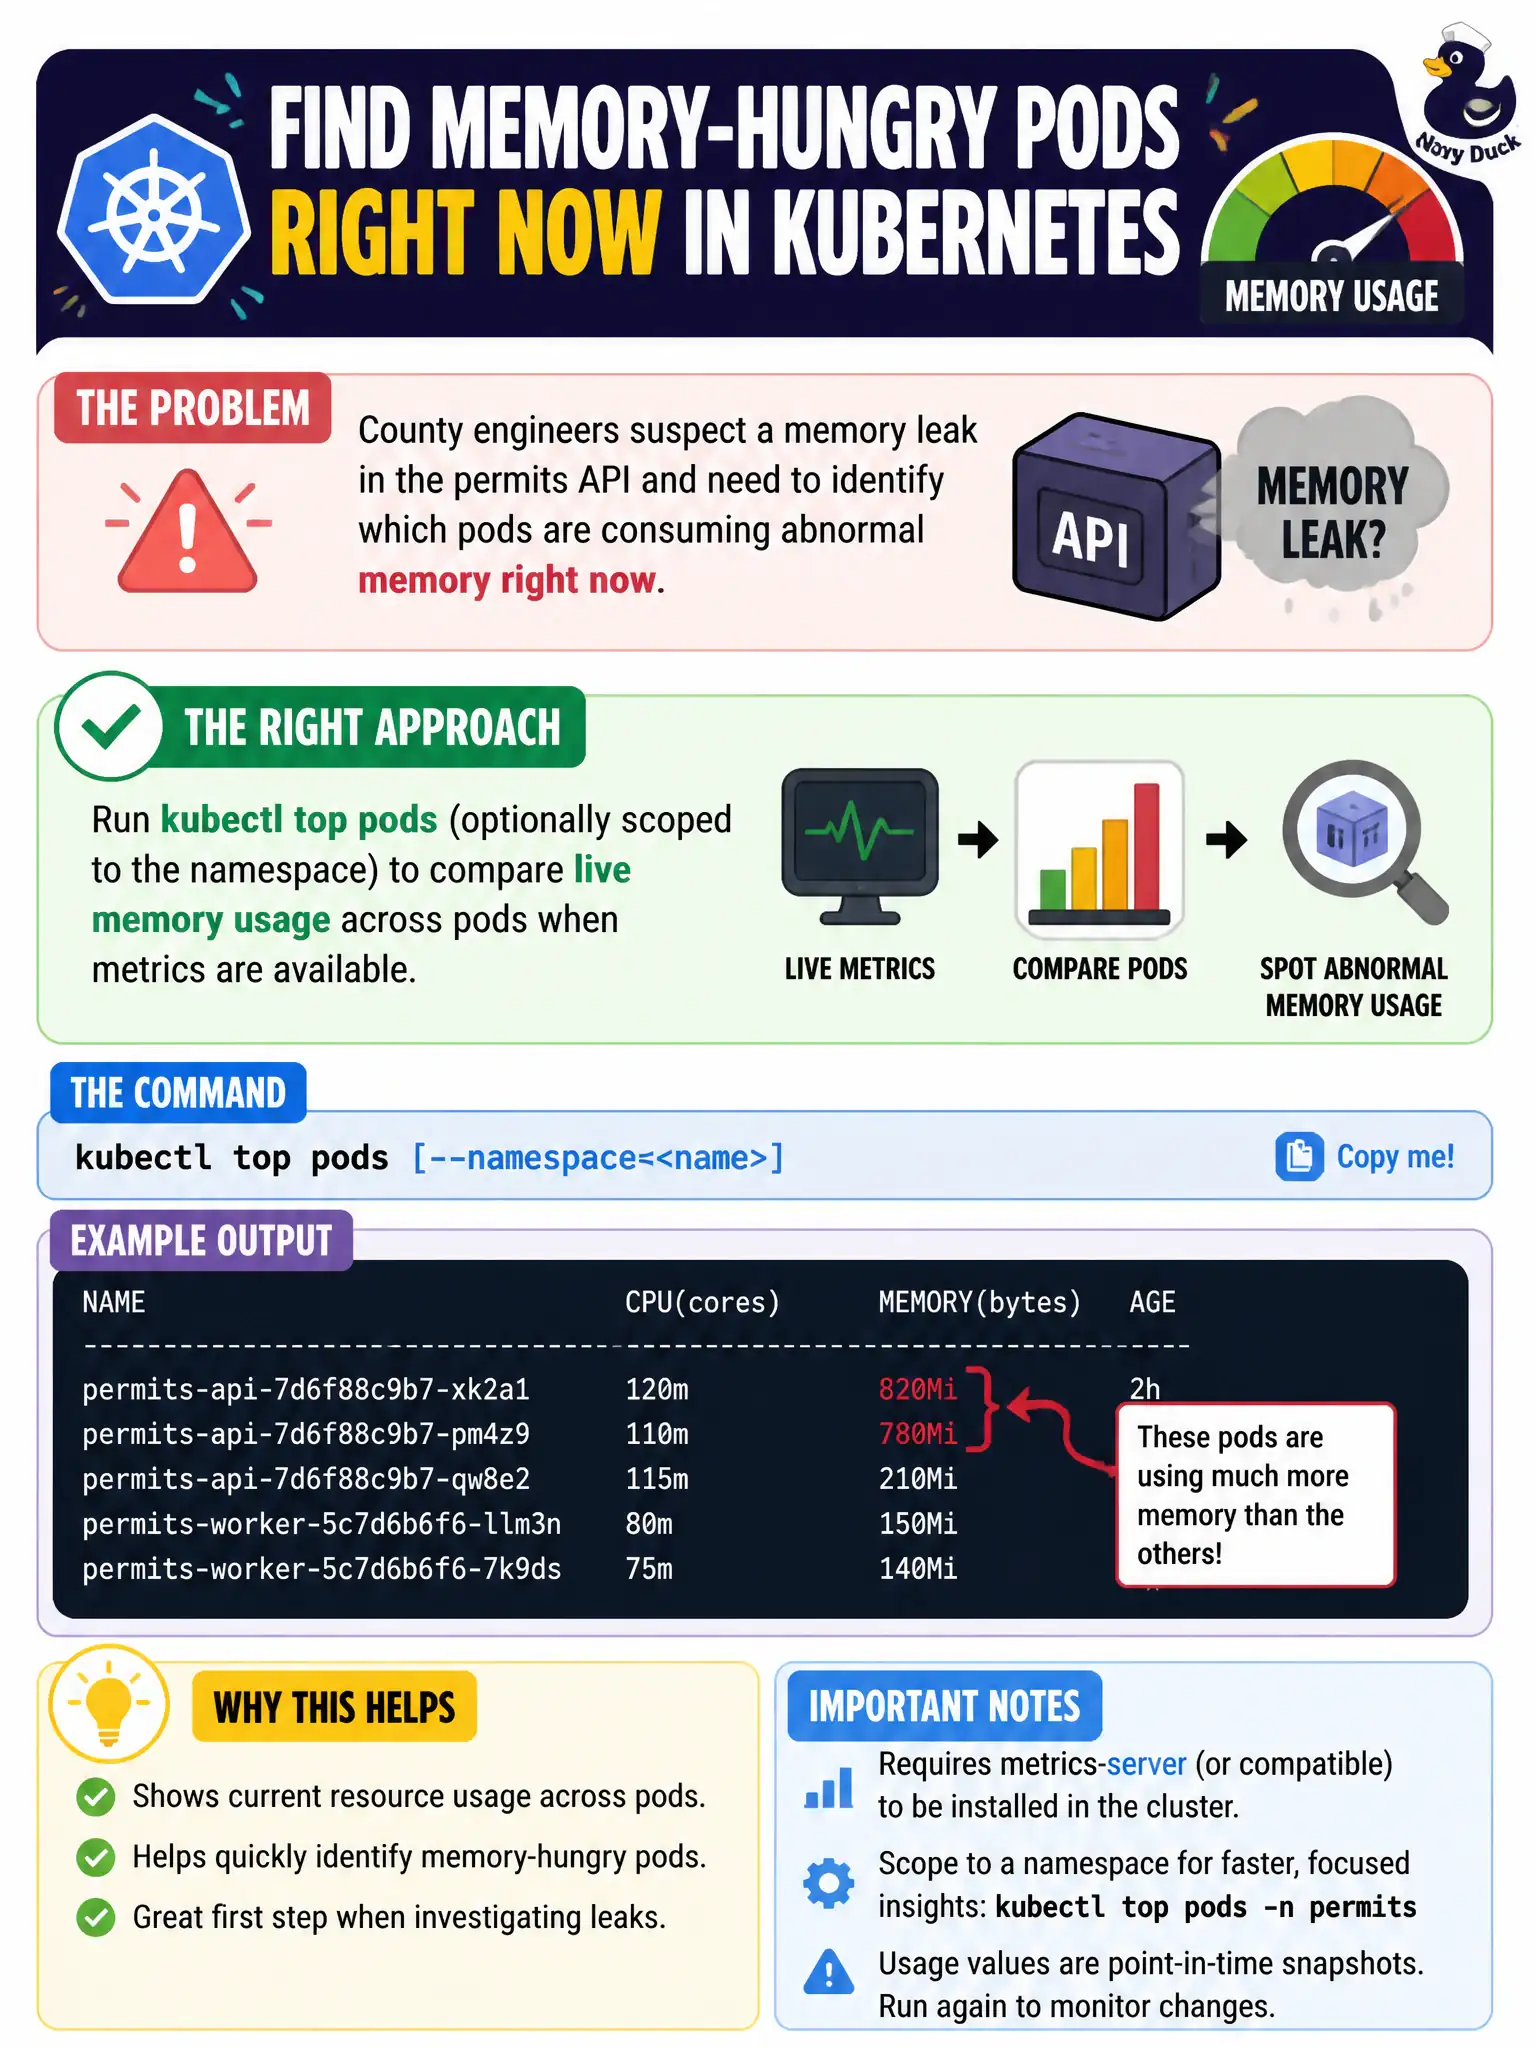
County engineers suspect a memory leak in the permits API and need to identify which pods are consuming abnormal memory right now. Which approach fits?
Select an answer to reveal the explanation.
Short Explanation
kubectl top pods is like walking the server room with a thermal camera for memory—hot pods stick out so you can chase the leak.
Full Explanation
To identify which permits-API pods are consuming abnormal memory right now, run kubectl top pods (optionally scoped to the namespace) when metrics are available. Comparing live memory across pods highlights leak candidates the way a thermal camera highlights hot racks in a county server room, letting engineers chase the offender with evidence instead of random restarts. Deleting the Default StorageClass does not force pods to report memory in Events and would disrupt dynamic provisioning for other teams—irrelevant and harmful as a leak-finding technique. kubectl drain on random nodes is a disruptive maintenance action that evicts workloads; it is not a diagnostic method for revealing which pods hold leaked memory. Ingress annotations do not store per-pod RSS samples for troubleshooting memory leaks; that option invents a nonexistent metrics channel unrelated to the Metrics API. Exam caveat: top requires the metrics API to be serving; historical leak trends need longer-retention monitoring. For the exam’s “right now” framing, top pods is the appropriate first approach. Operational check: Run kubectl top pods -n <permits-ns> sorted by memory, correlate outliers with restart counts and application logs, then fix the leak or adjust resources using measured data rather than guesswork.