
During a council-demo traffic spike, city SREs want a quick view of CPU and memory pressure per node. Which command is appropriate when metrics are available?
Select an answer to reveal the explanation.
Short Explanation
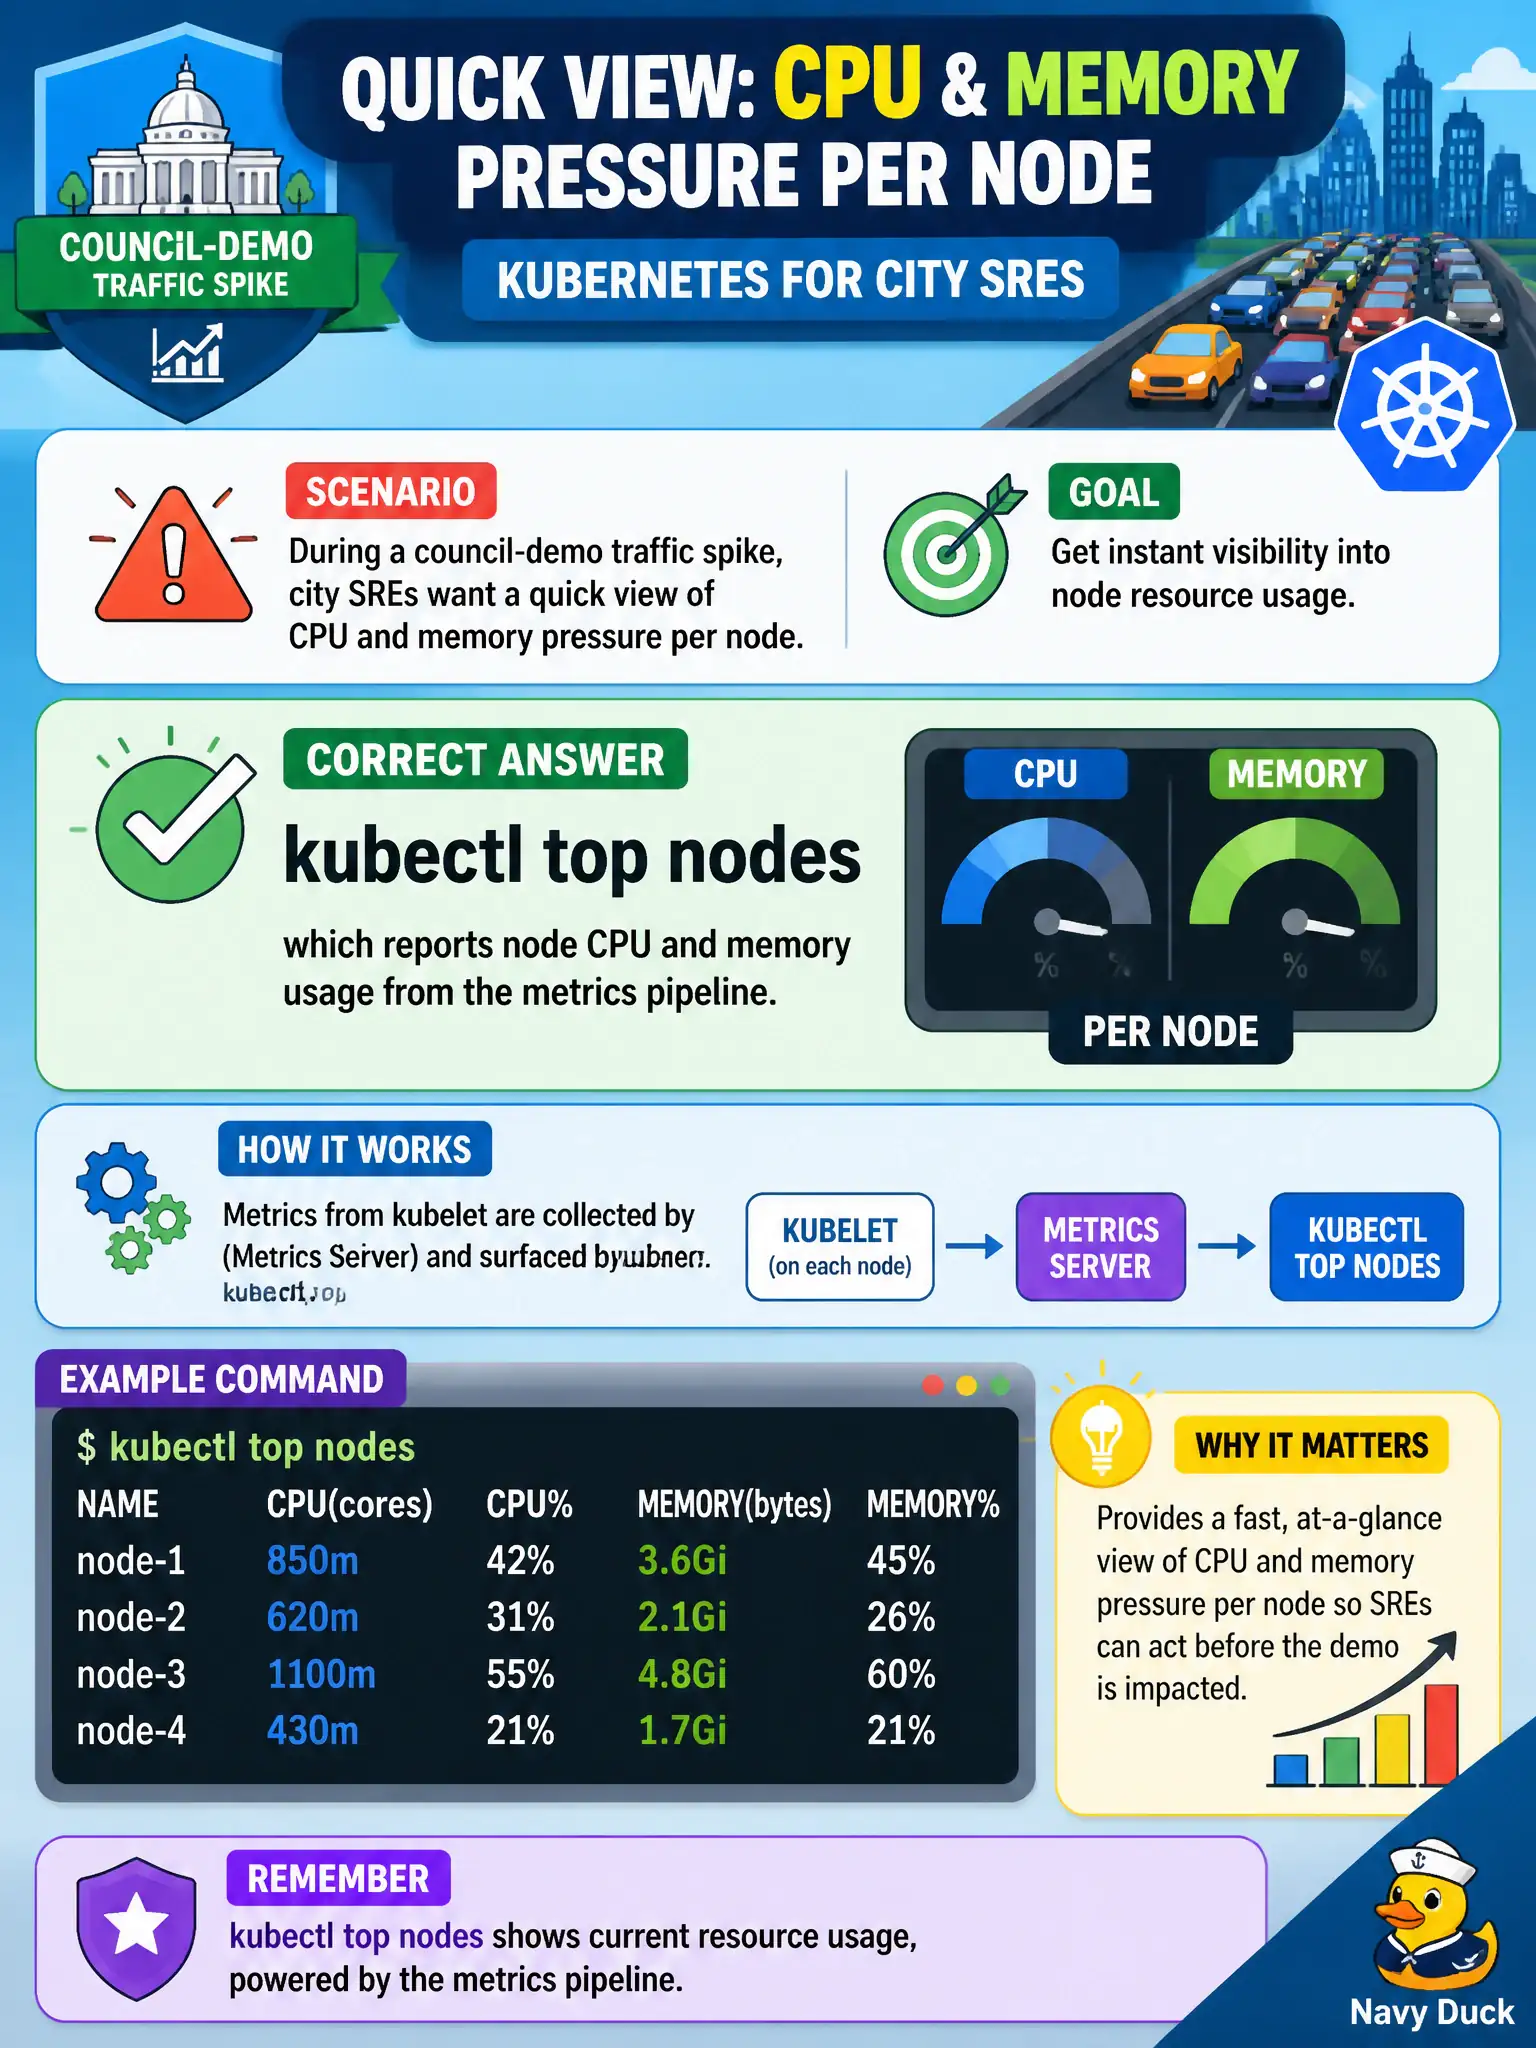
kubectl top nodes is the glance-at-the-fuel-gauges command—CPU and memory per node—when metrics-server (or equivalent) is feeding data.
Full Explanation
When resource metrics are available, kubectl top nodes reports CPU and memory usage per node—the quick fuel-gauge view city SREs want during a council-demo traffic spike. It reads from the metrics pipeline (commonly metrics-server) rather than from unrelated authorization, cordon, or discovery commands, giving an immediate picture of which workers are under pressure while citizens hit the demo. kubectl auth can-i answers RBAC authorization questions about whether a user or service account may perform a verb on a resource; it does not print live node CPU percentages sourced from etcd or elsewhere. kubectl cordon marks a node unschedulable for maintenance windows; it does not display memory pressure graphs or utilization samples for every node in the cluster. kubectl api-resources lists available API resource types and preferred versions; it does not stream real-time node utilization samples for capacity triage. Exam caveat: Without metrics-server or an equivalent metrics pipeline, kubectl top fails—know that dependency on the exam. top shows observed usage, not requests or limits, so pair it with describe and capacity views when planning changes. Operational check: Confirm metrics-server health and APIService availability, run kubectl top nodes during the spike, identify saturated municipal workers, and decide whether to cordon, scale node pools, or tune noisy workloads before the demo audience notices.