
Library HPA objects are not scaling and kubectl top in that namespace also returns no metrics. What does this combination most strongly suggest?
Select an answer to reveal the explanation.
Short Explanation
If both top and HPA are blind, the metrics hose is kinked—usually metrics-server or the metrics path—not a NetworkPolicy magic switch.
Full Explanation
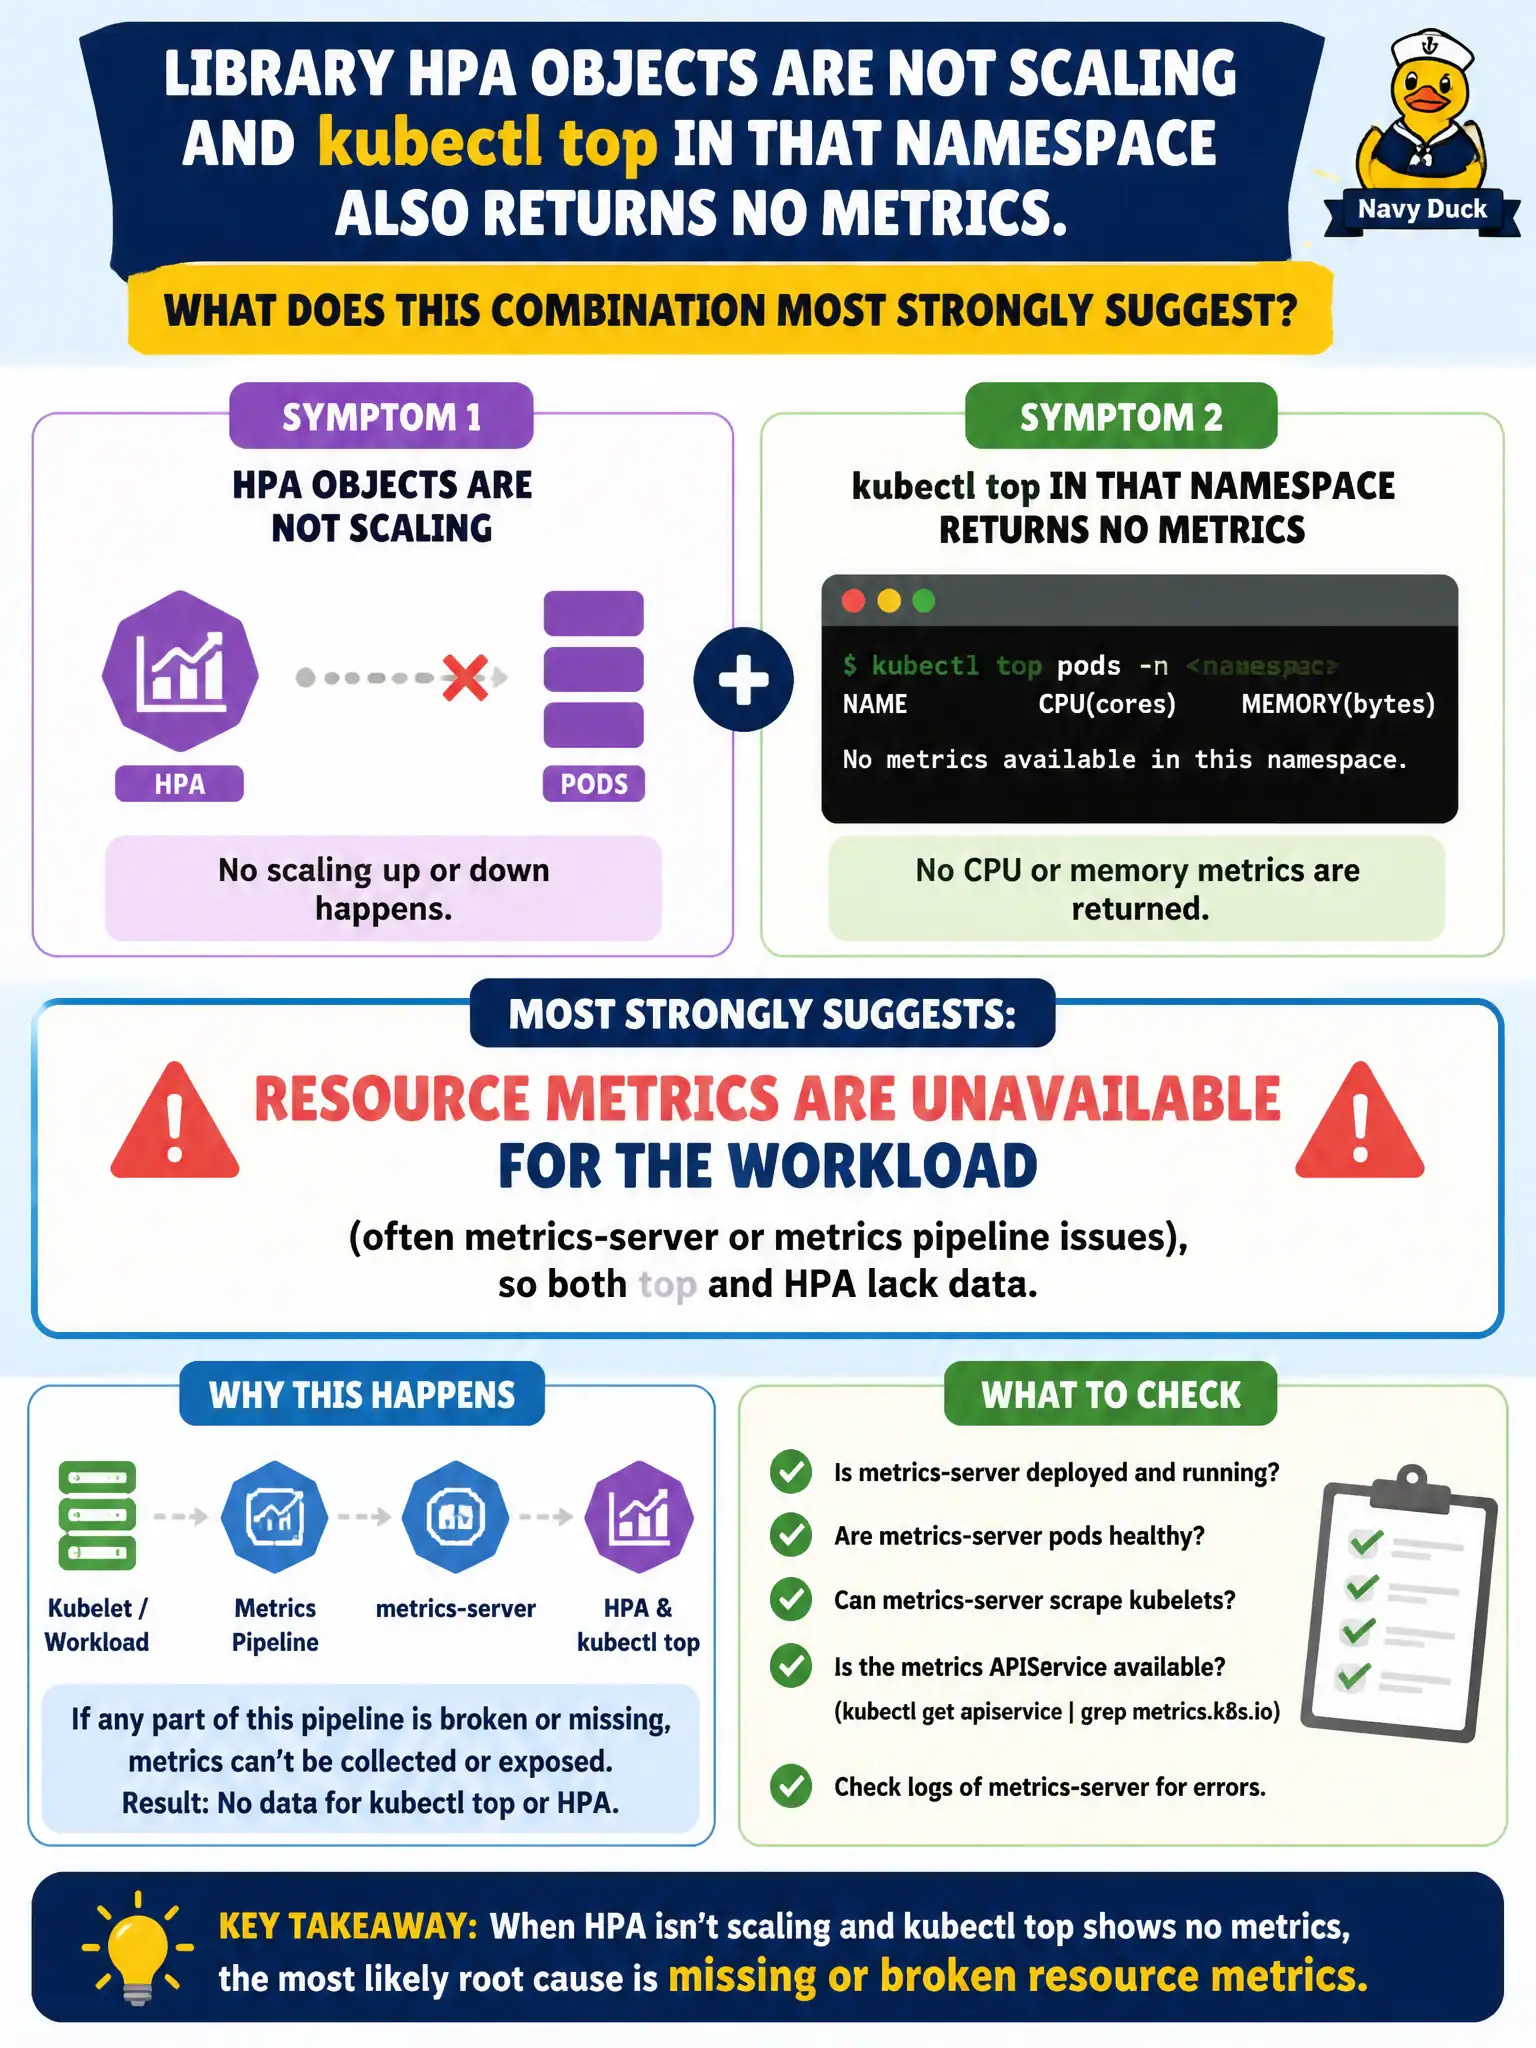
When library HPA objects are not scaling and kubectl top in that namespace also returns no metrics, the combination most strongly suggests resource metrics are unavailable for the workload—often metrics-server or broader metrics pipeline issues—so both top and HPA lack the samples they need to function. Shared blindness is the clue. NetworkPolicies do not always disable HPA and kubectl top even when metrics-server is healthy; network policies govern allowed traffic paths, not whether the resource metrics API exists for autoscaling and top. PersistentVolume reclaim policies do not uniquely suppress the metrics API for Deployments; reclaim semantics govern volume lifecycle after claim deletion and are unrelated to metrics availability. A Ready node condition is not sufficient for HPA to scale without any metrics backend; HPA must observe actual resource or custom metrics before it can compute a new replica count. Exam caveat: Namespace-scoped HPA issues can also stem from missing CPU/memory requests or a bad scaleTargetRef—but simultaneous failure of kubectl top points first at metrics availability. Operational check: Inspect metrics-server pods and the metrics.k8s.io APIService, repair scraping or RBAC problems, re-run kubectl top in the library namespace, and confirm HPA status shows usable metrics and desired replica calculations again.