
The CISO prepares a quarterly pack for the city manager on security-program health. Which data best serves as key performance and risk indicators?
Select an answer to reveal the explanation.
Short Explanation
KPIs and KRIs are the dashboard lights—patch lag and phish-click trends tell you if the program is improving. Poster counts, coffee uptime, and wallpaper gripes are noise, not risk indicators.
Full Explanation
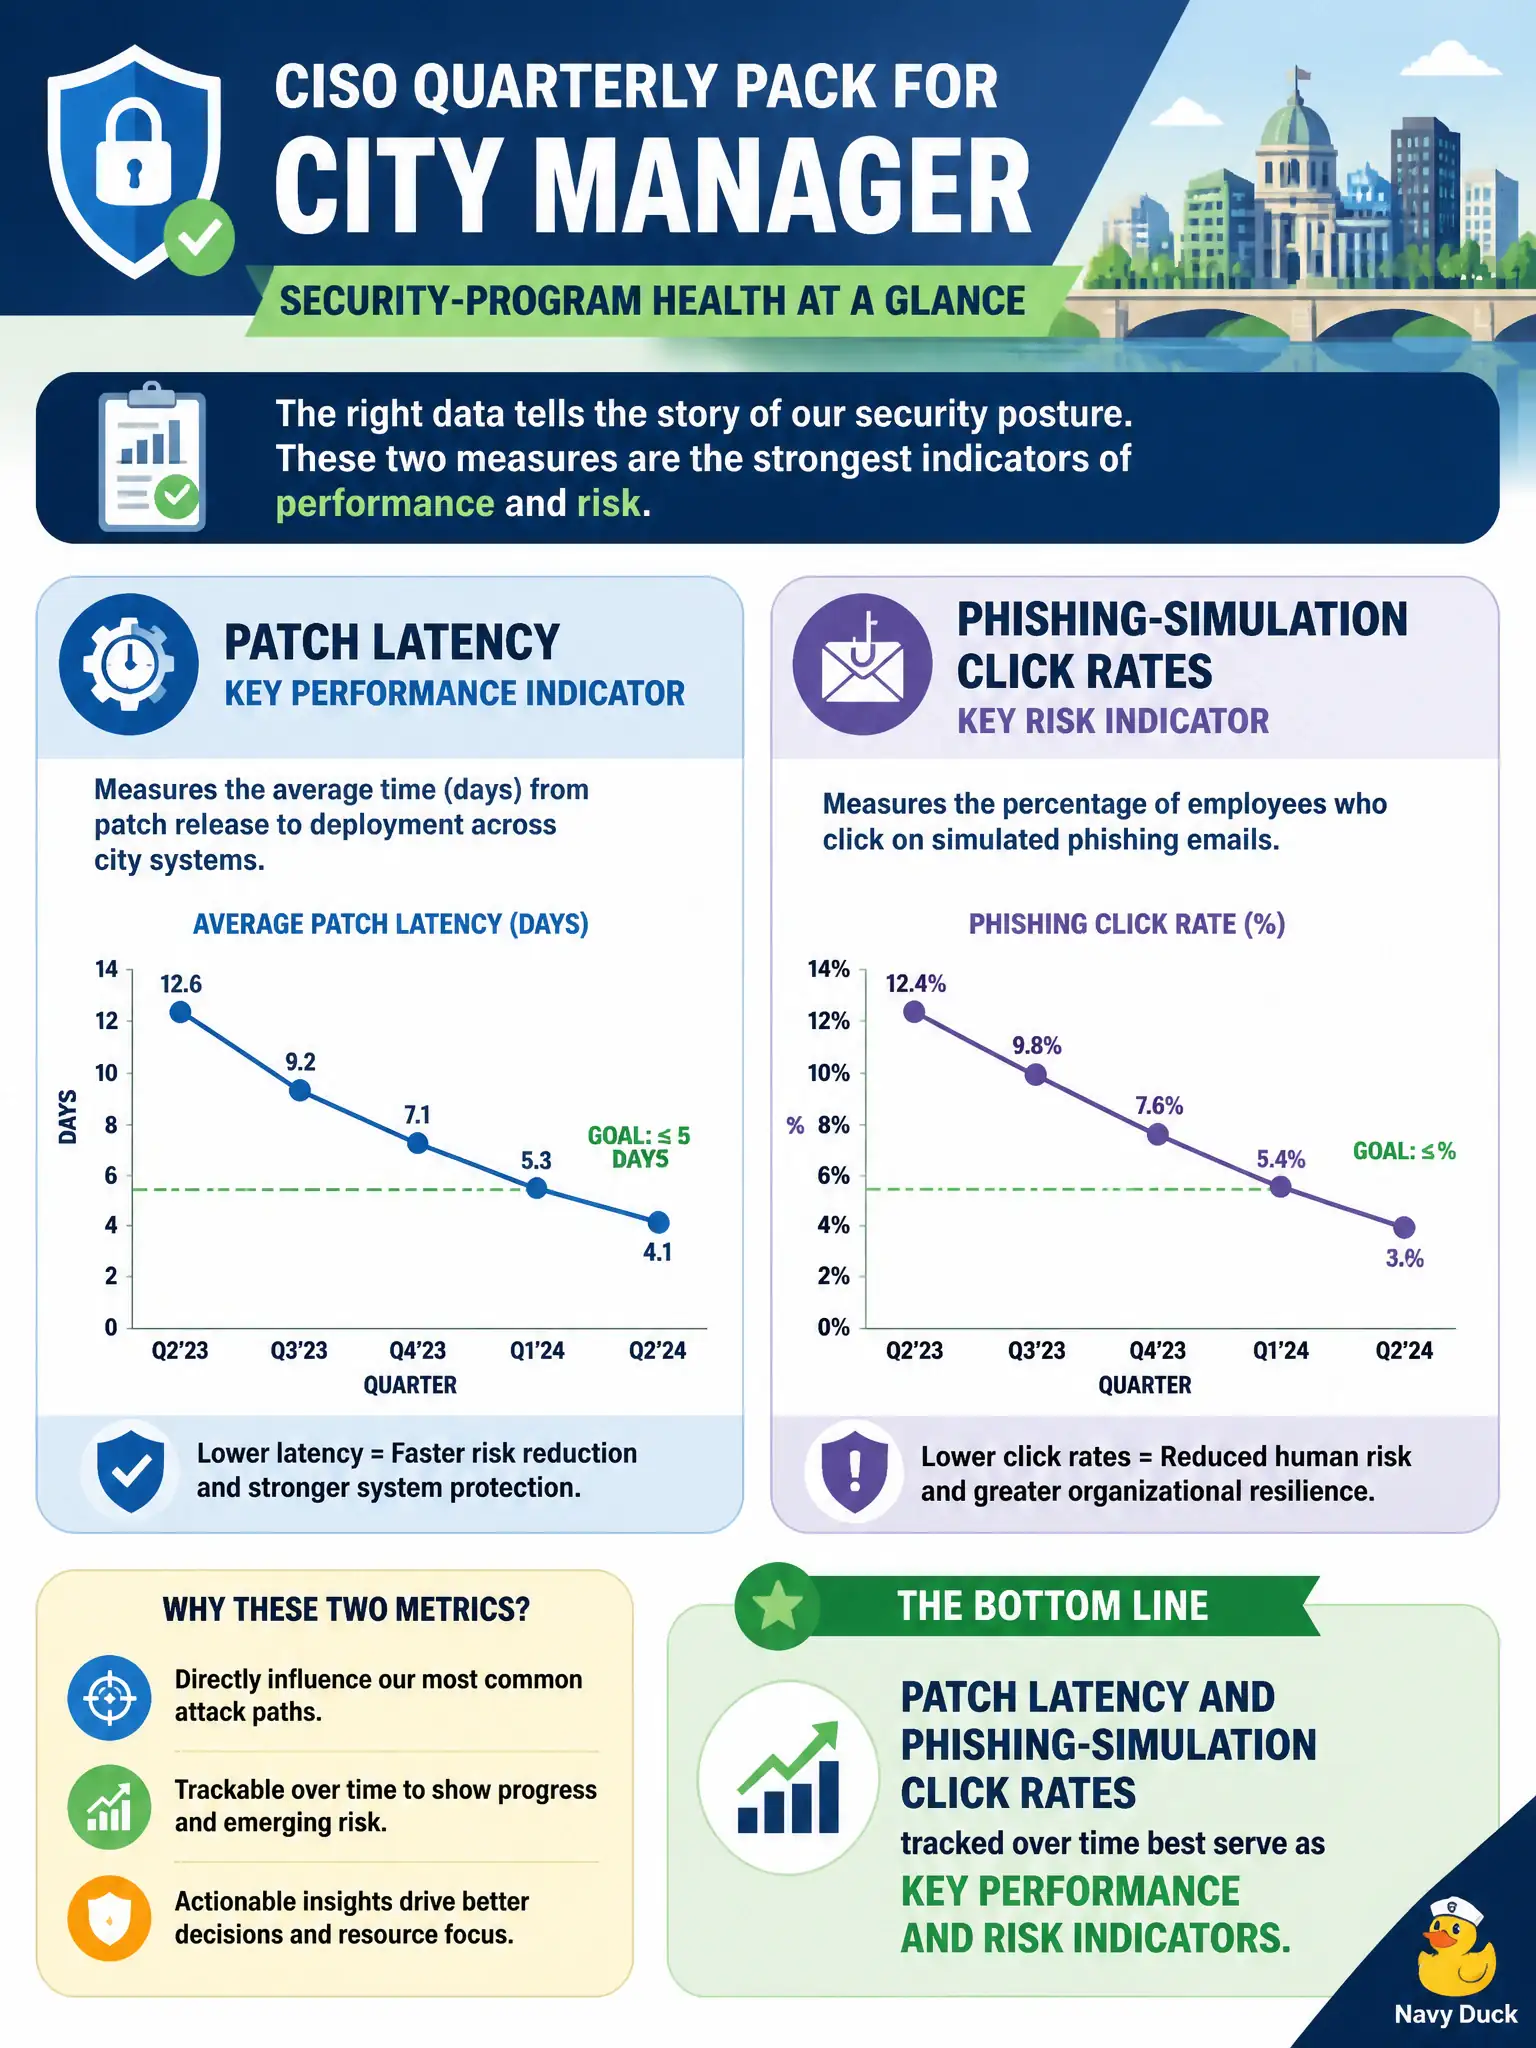
Key performance and risk indicators quantify whether security processes meet targets and how risk is trending. Patch latency and phishing-simulation click rates tracked over time are classic KPIs/KRIs tied to vulnerability management and human-risk reduction—exactly the kind of data a CISO should put in a quarterly pack for a city manager. They are measurable, actionable, and linked to residual risk rather than activity theater.
The number of hallway posters printed about phishing measures awareness collateral volume, not behavior change or risk reduction. Office coffee-machine uptime is facilities noise with no security-program meaning. Unresolved aesthetic complaints about SOC wallpaper are irrelevant to control performance and distract leadership from genuine risk indicators.
Exam caveat: KPIs/KRIs must relate to security objectives and risk. Exam distractors often offer busywork counts; prefer latency, failure rates, coverage, and trendable human-risk metrics.
Operational check: Publish patch latency by severity tier and phish click/report rates with targets and trend lines in the city manager pack; explain movements with root causes; and trigger management actions when thresholds breach rather than celebrating poster campaigns.