
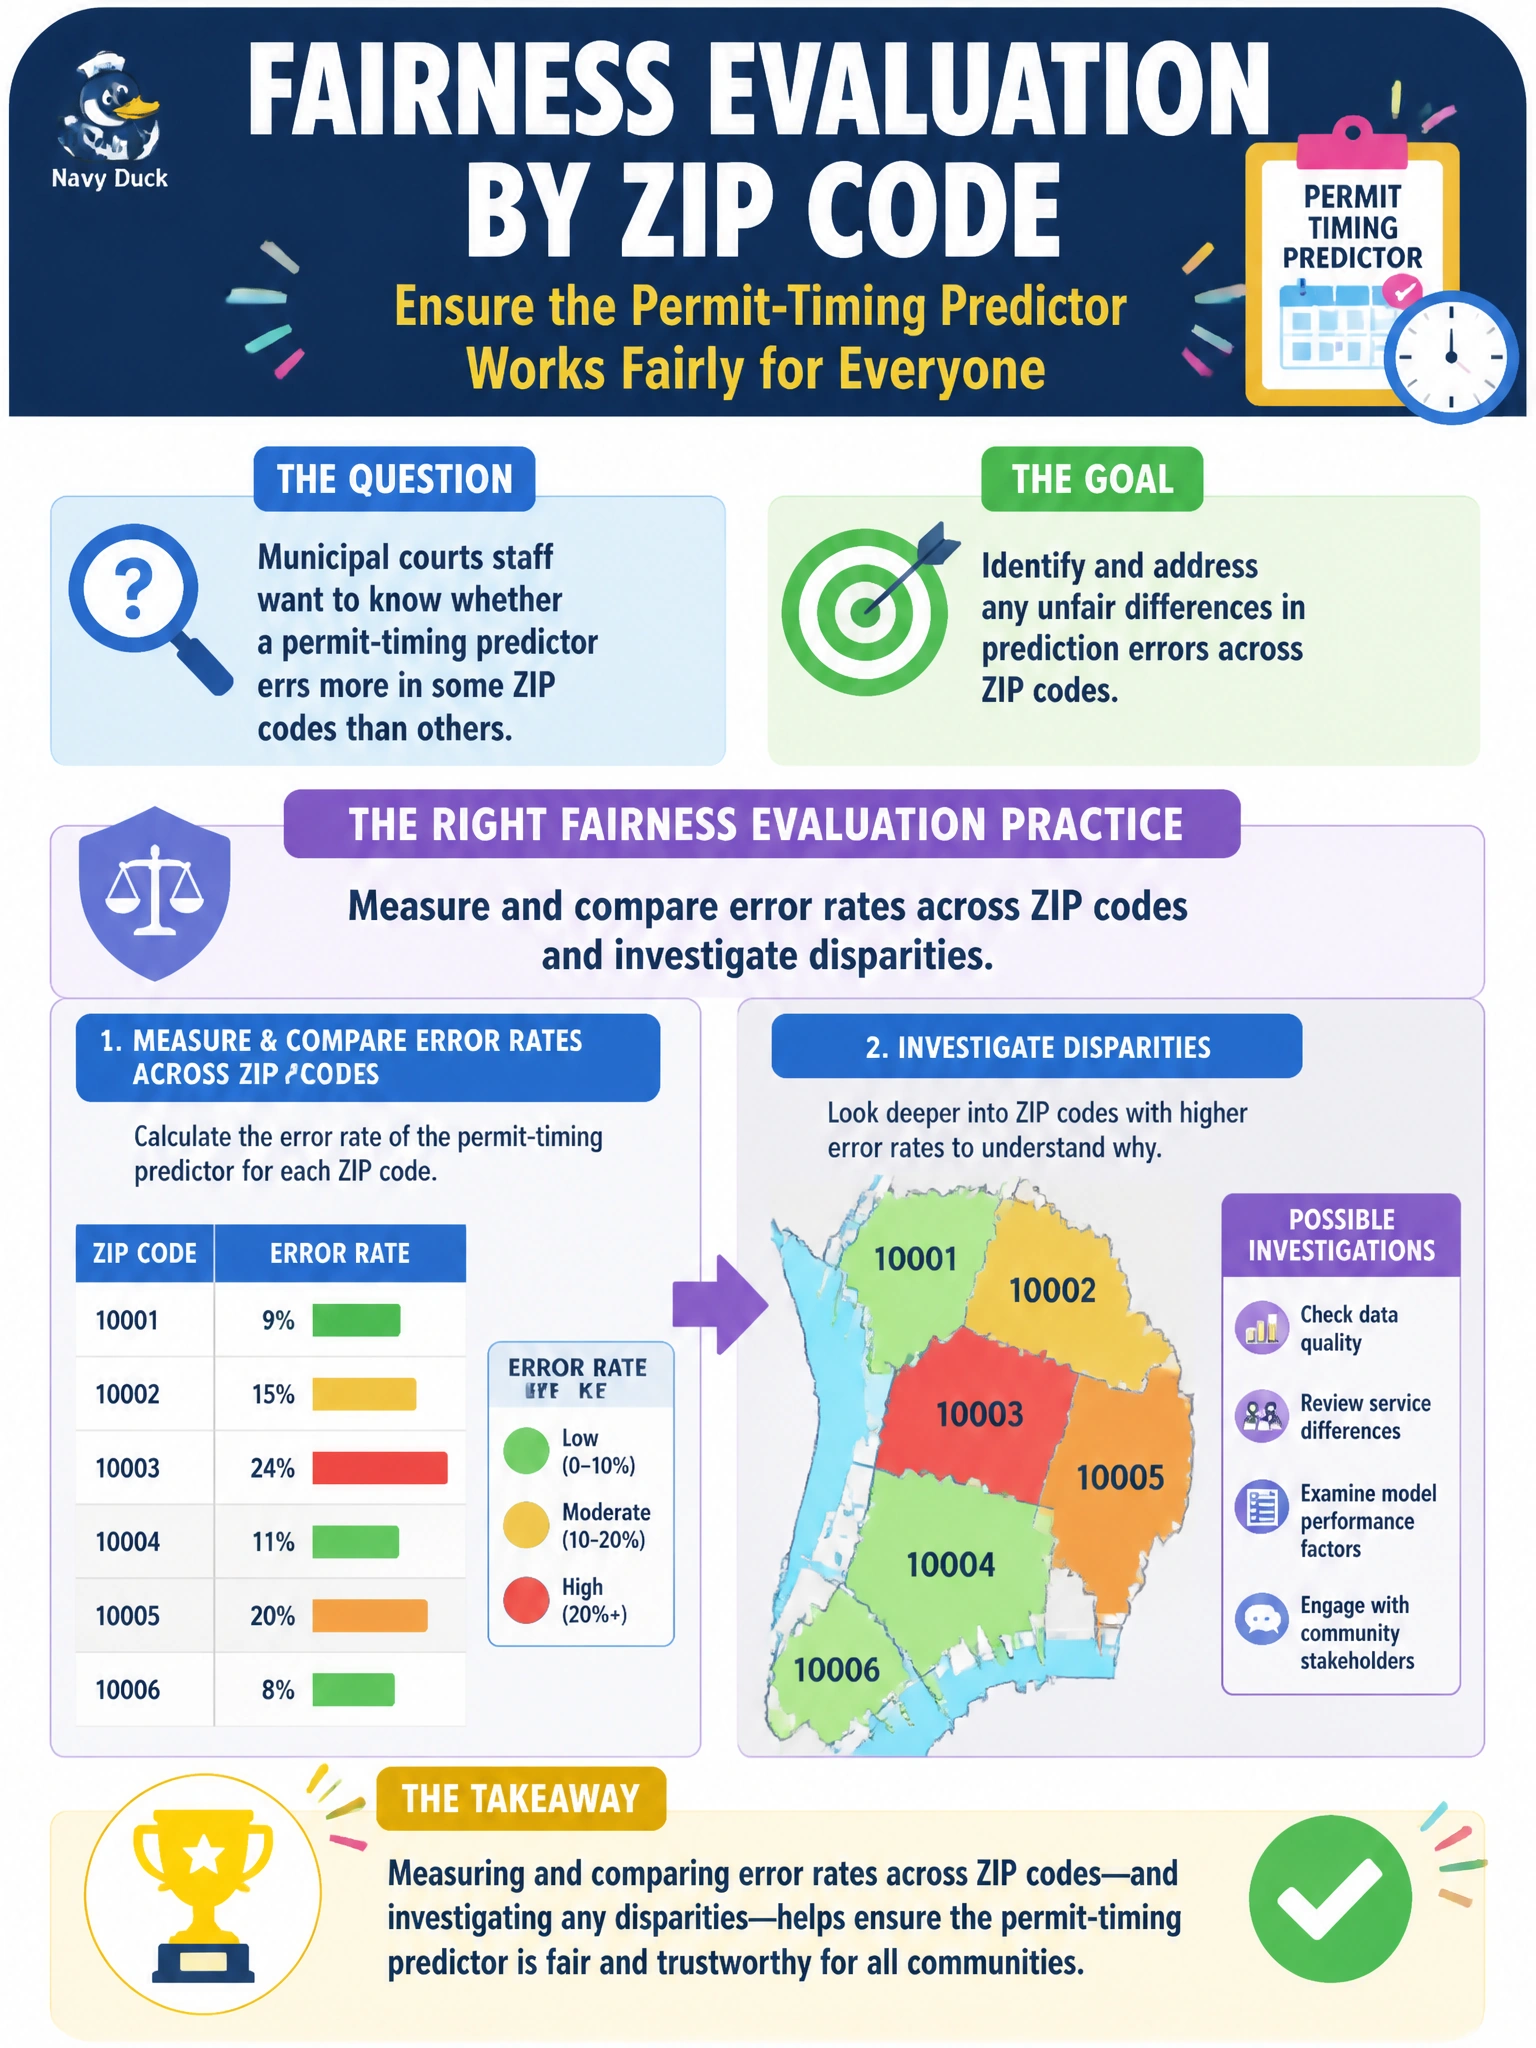
Municipal courts staff want to know whether a permit-timing predictor errs more in some ZIP codes than others. Which fairness evaluation practice should they use?
Select an answer to reveal the explanation.
Short Explanation
Citywide averages can hide a ZIP that always gets the short end. Slice error rates by geography, then dig into the disparities—fairness shows up in the breakdowns.
Full Explanation
Fairness evaluation for a municipal courts permit-timing predictor asks whether error rates differ across groups or geographies—here, ZIP codes that may correlate with neighborhood resources and filing patterns. Staff should measure and compare errors by ZIP, investigate disparities (data sparsity, feature proxies for protected attributes, process differences), and only then design mitigations. Citywide averages can look acceptable while some neighborhoods systematically get worse predictions that affect filing expectations and staffing plans.
Using only average citywide accuracy ignores geography and can mask concentrated harm. Excluding ZIP codes with poor performance from every report conceals inequity rather than fixing it. Assuming equal error rates because the model uses the same code everywhere confuses identical software with identical outcomes across uneven data.
Exam caveat: slicing by ZIP alone may miss other service-relevant dimensions (language, filing channel, case type); intersectional or multi-slice checks may still be required. Statistical noise in small ZIPs needs careful interpretation, not denial of disparities.
Operational check: produce a disparity report with per-ZIP error rates and uncertainty, set investigation thresholds with policy owners, and pause high-stakes use in slices that fail fairness criteria until root-cause analysis and mitigation are complete.