
A parks and recreation team wants alternate visual styles for map legends on public dashboards. How should they distinguish generative image tools from GIS analytical tools?
Select an answer to reveal the explanation.
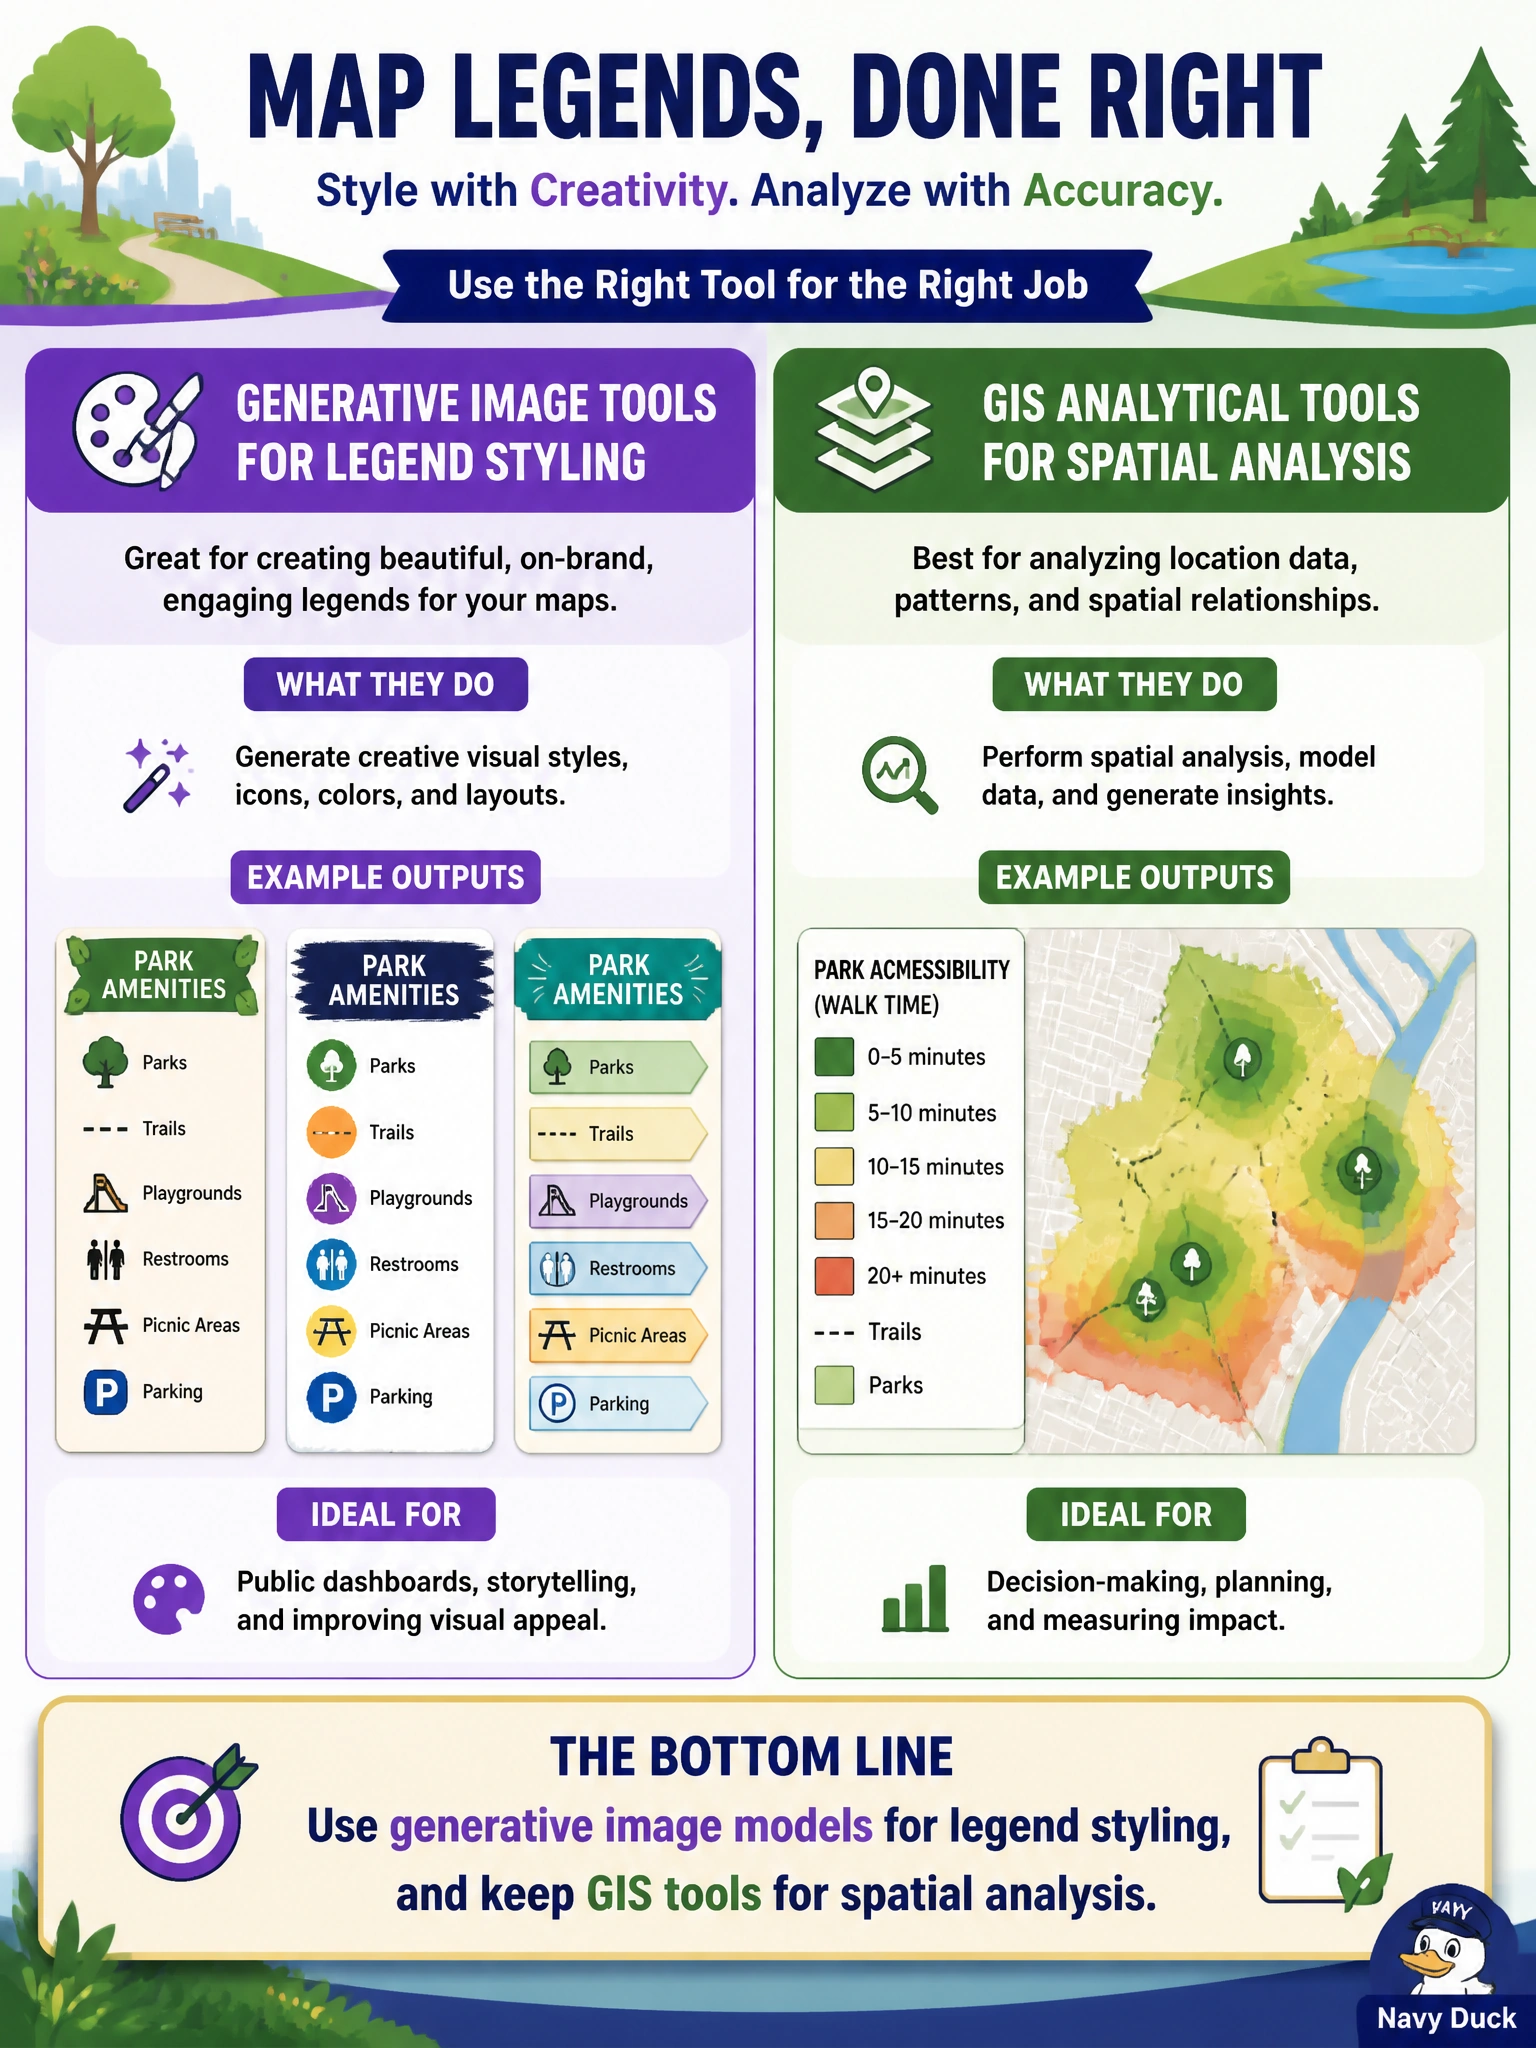
Short Explanation
Pretty legend styles are art; acreage and buffers are math. Let an image model dress up the legend, and leave the GIS stack to do the spatial thinking. Mixing those jobs is how dashboards get cute—and wrong.
Full Explanation
Parks and recreation should use generative image models for legend styling and keep GIS tools for spatial analysis: diffusion or similar models can vary visual treatments, while GIS remains authoritative for joins, buffers, acreage, and ownership. Public dashboards benefit from clearer legends and accessible color treatments, but those creative choices must not silently replace analytical engines that compute where parks are and who owns parcels. Treating a diffusion model as a replacement for spatial join and buffer analysis confuses pixels with geospatial computation and will produce non-authoritative ‘maps.’ Using generative images to compute acreage and parcel ownership automatically cannot yield trustworthy cadastral results—those require GIS/cadastral data and geometry operations. Disabling GIS entirely once generative artwork appears on the dashboard removes the analytical foundation residents and auditors rely on. Exam caveat: generative image tools augment presentation; they do not absorb GIS analytical responsibility. Operational check: pipeline design should export geometries and attributes from GIS, apply generative styling only to legend/UI chrome or illustrative overlays, watermark non-authoritative art, and regression-test spatial queries after any dashboard redesign so acreage and ownership figures remain GIS-sourced.