
A SOC using Splunk Enterprise Security wants an alert when the same user fails authentication on several different systems within a short window and then succeeds on one of them. Which Splunk ES mechanism should produce this alert?
Select an answer to reveal the explanation.
Short Explanation
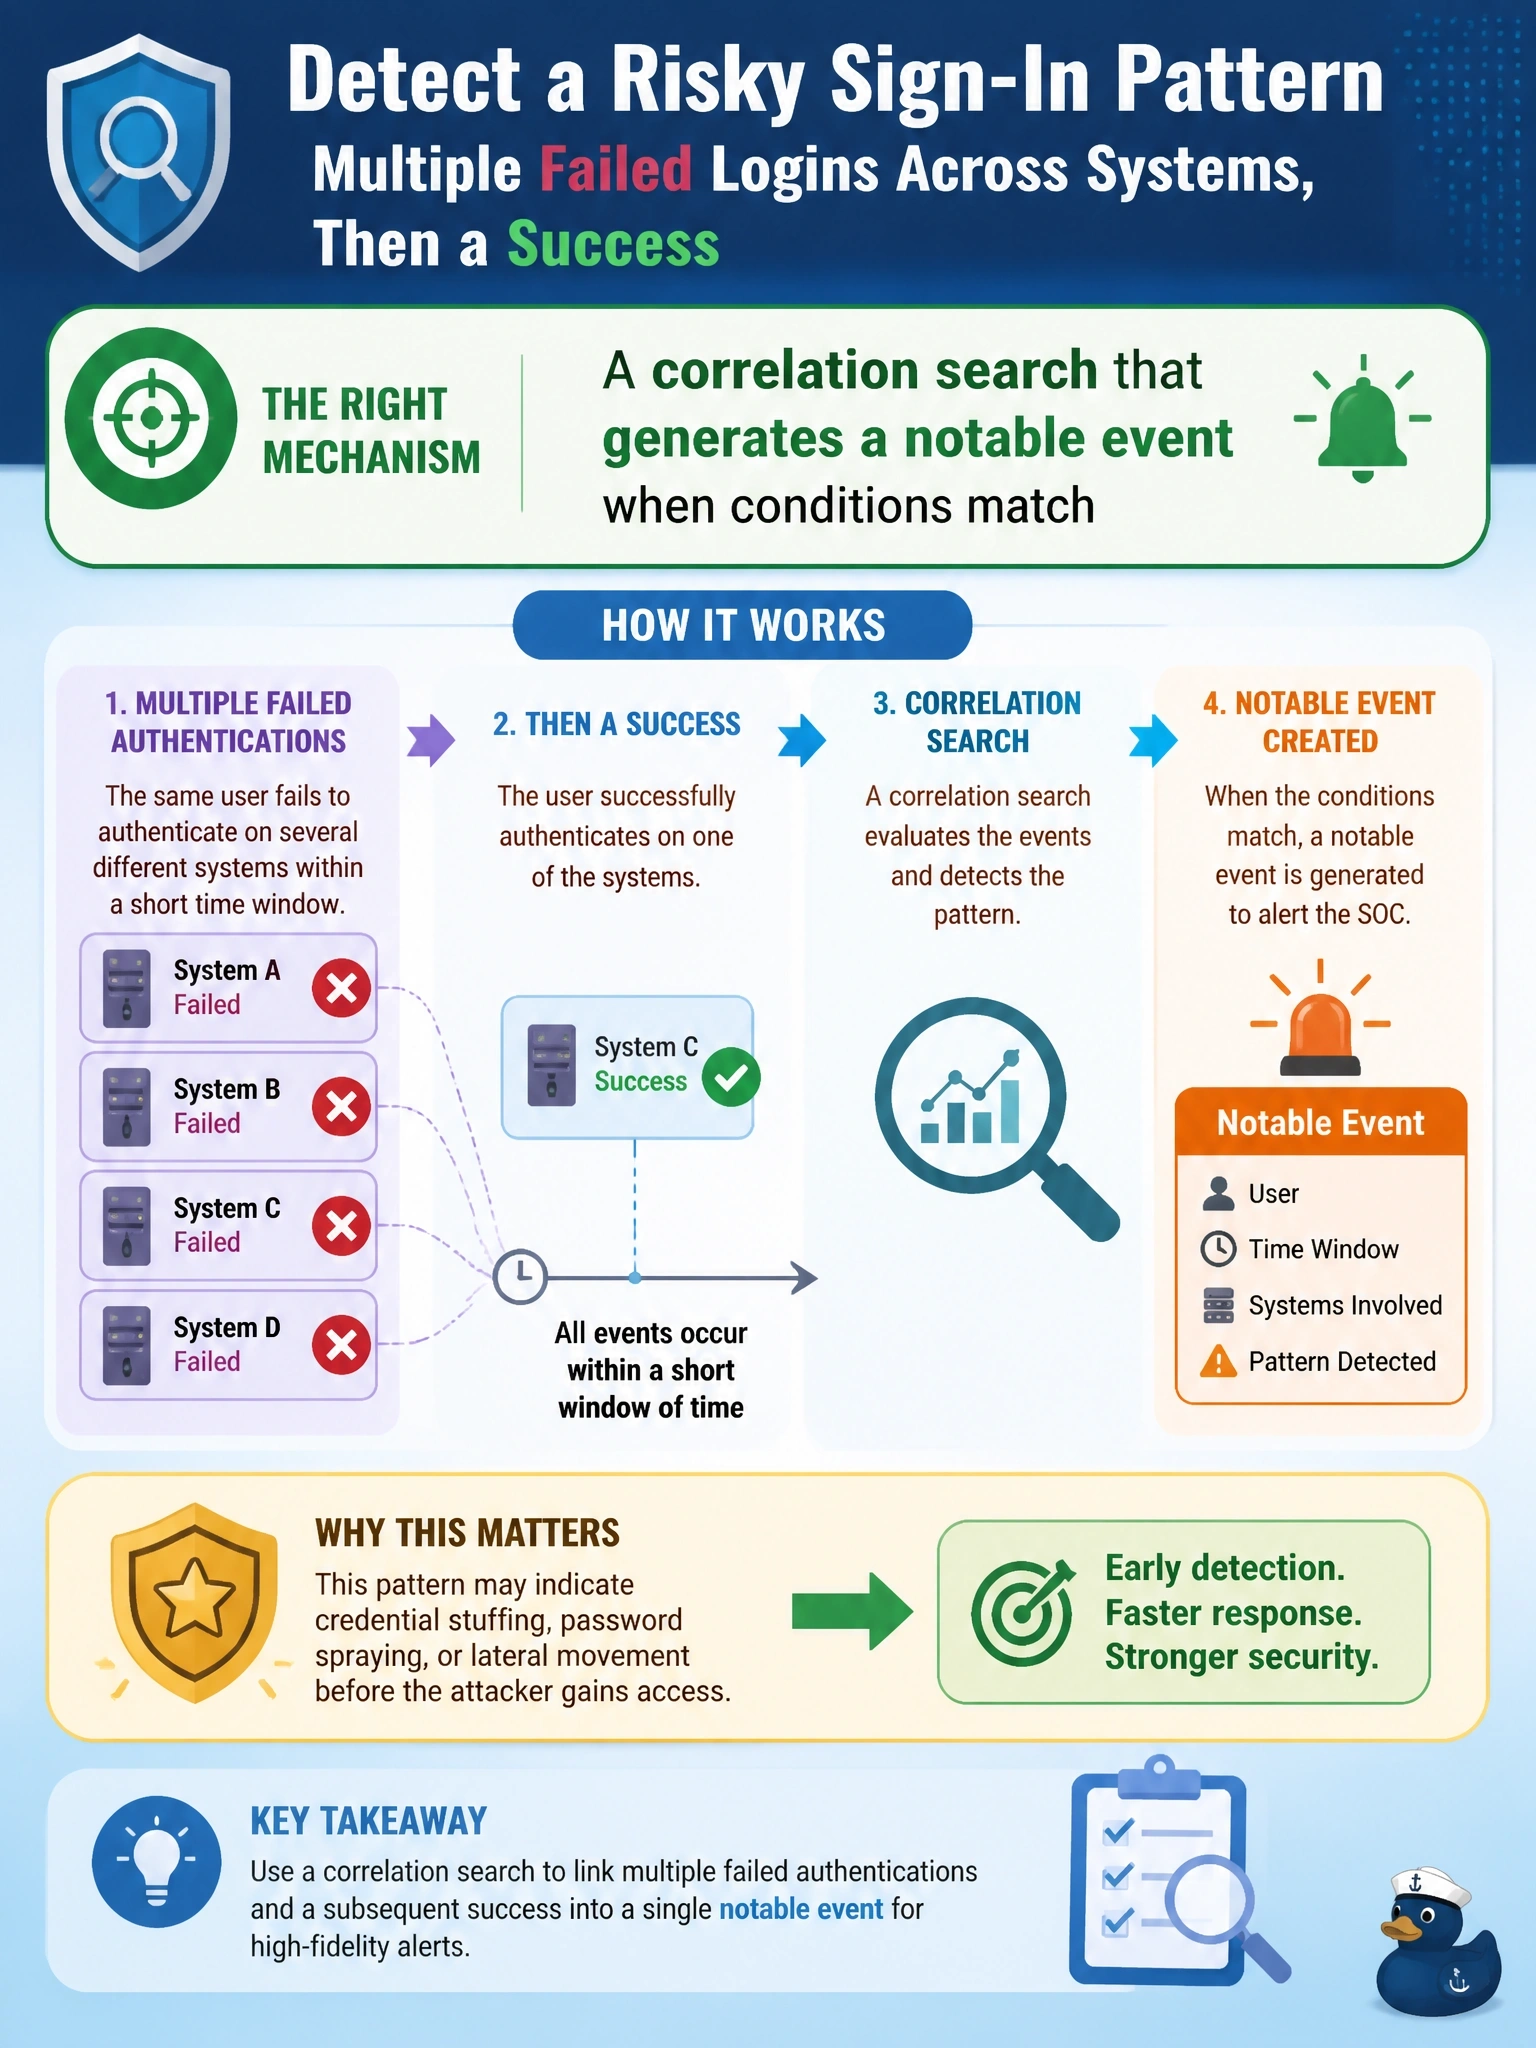
This is a pattern across systems, so you need something that keeps watching and fires when the pattern shows up. That's a correlation search, and when it matches, ES drops a notable event in the analyst's queue. A dashboard is the trap; it only helps if somebody happens to be staring at it.
Full Explanation
In Splunk Enterprise Security, correlation searches are scheduled searches that look for conditions across normalized data, typically using the data models aligned with the Common Information Model, such as the authentication data model. A search that counts failures by user across distinct destinations within a time window and then checks for a subsequent success matches a brute-force or password-spraying-followed-by-compromise pattern. When the conditions are met, the correlation search creates a notable event, which appears in the analyst review queue with severity, owner and status fields for triage. A dashboard panel visualizes failures but produces no alert and depends on someone watching at the right moment. An HTTP Event Collector token is an ingestion method for sending data into Splunk; it affects how authentication logs arrive, not whether a pattern is detected. A lookup listing users allowed to fail repeatedly could tune false positives inside a search, but by itself it detects nothing. Exam caveat: newer Enterprise Security releases rename some of these objects, for example describing notable events as findings, but the correlation-to-alert mechanism is the same. Operational check: run the search manually over a period with a known test pattern and confirm it returns the user and generates a notable event when scheduled.