
A financial firm is sizing an ISE VM to handle RADIUS, profiling collection, and session logging for 12,000 endpoints on a hypervisor shared with other guests. During load testing, datastore latency rises while CPU and memory remain within their configured limits. Which ISE VM resource is most likely to be the bottleneck?
Select an answer to reveal the explanation.
Short Explanation
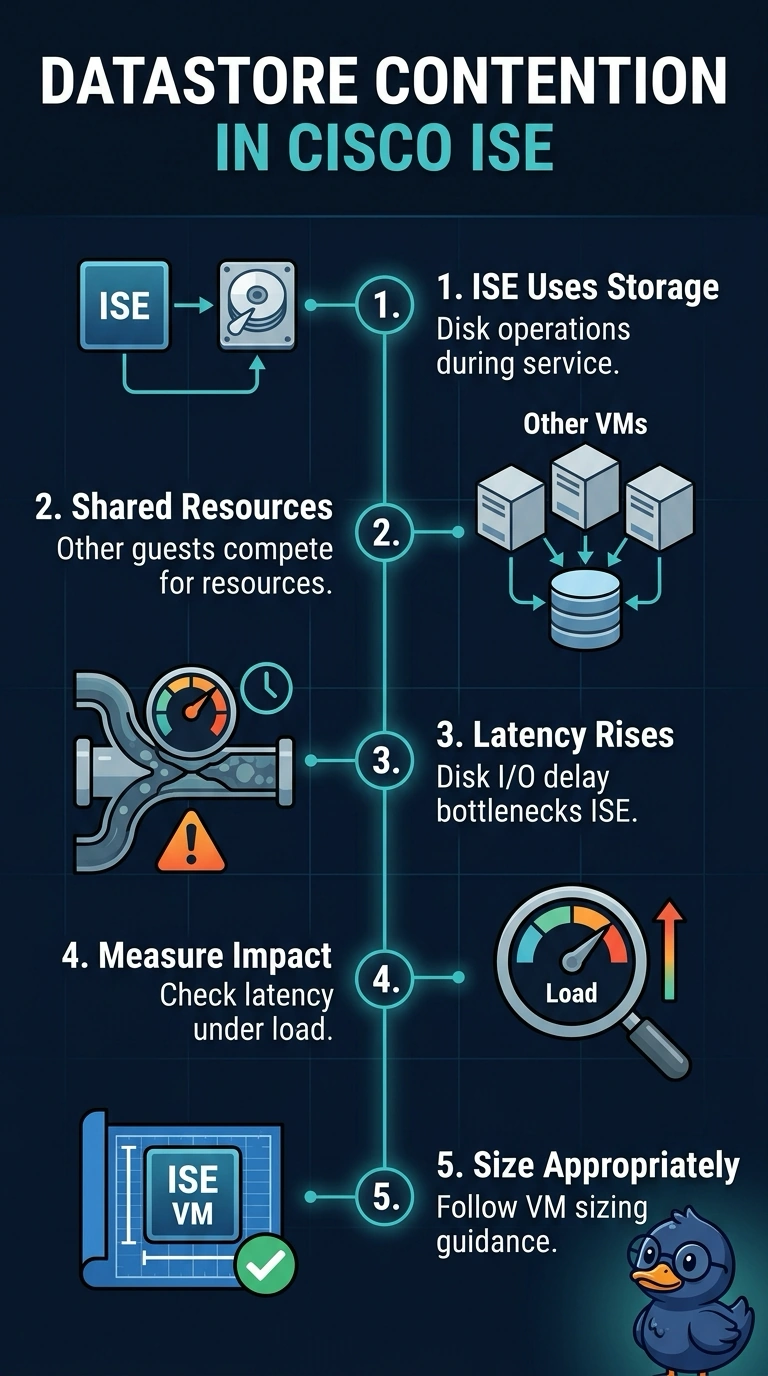
Your datastore is slowing down, making disk I/O the likely bottleneck even though CPU and memory are within limits. It’s like a checkout line backing up while the other lanes are clear—storage contention is delaying ISE’s disk operations.
Full Explanation
Disk I/O is the most likely bottleneck because RADIUS activity, profiling collection, and session logging all require ISE to perform disk operations. On a hypervisor shared with other guests, datastore contention can delay those operations; the observed rise in datastore latency during load, while CPU and memory remain within their configured limits, points to storage performance rather than compute or memory as the current constraint. Peak authentication rate is a compute-capacity approach: bursts of RADIUS/EAP requests can tax CPU, but the stated CPU results do not indicate that limit. Available memory supports ISE processes and data, yet memory is not implicated by the test results. Thin-provisioned capacity concerns how much storage is available as sessions and logs consume space; capacity exhaustion is distinct from slow disk access, and the scenario identifies latency rather than insufficient space. Exam caveat: endpoint count alone does not establish a bottleneck, and authentication rate, memory, and capacity may still constrain a deployment under different conditions. Practical check: correlate ISE VM disk performance and datastore latency with the load test, verify contention on the shared datastore, and compare the deployment with applicable Cisco ISE VM sizing guidance.