
During peak hours a payments company watches a vendor's TLS flows disappear, and FMC logs show no connection events for them. You need the exact stage where the packets are dropped, and any extra load on the production device must stay minimal. Which troubleshooting approach pinpoints that engine stage with the least added load?
Select an answer to reveal the explanation.
Short Explanation
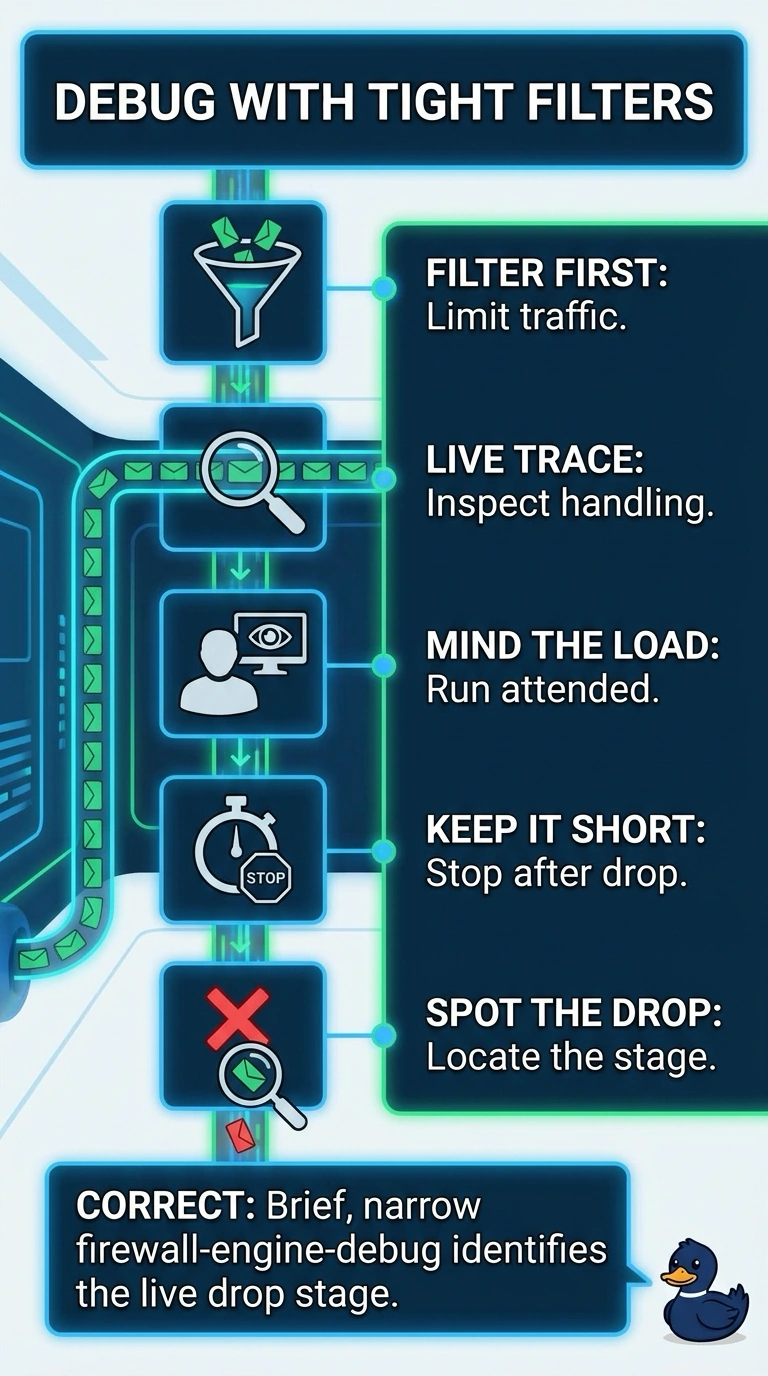
When connection logs are silent, a brief, tightly filtered firewall-engine-debug session shows you the live stage where packets are dropped—like a focused replay instead of reviewing the whole game. Keep it short and attended to limit added load; you’re tracing only what you need, though the impact can vary.
Full Explanation
A brief, narrowly filtered firewall-engine-debug session is the best fit because it observes the live flow and reports the engine stage responsible for a drop, while tight filters and a short run limit production overhead. A narrowly scoped capture on both interfaces is a sound, low-impact way to establish whether packets enter and leave the firewall, but packet presence or absence at an interface does not identify the internal engine stage that dropped them. Packet-tracer can efficiently show how a representative tuple would traverse policy and processing stages, but it simulates a flow rather than diagnosing the actual live packets, so it cannot establish their real drop stage. ASP drop-reason counters can reveal engine-level drop categories with little added load, but aggregate counters do not reliably attribute a change to this vendor’s particular flow or pinpoint its stage. Exam caveat: debug output can itself consume resources, and command behavior varies by platform and software release, so scope and duration matter. Practical check: confirm the vendor flow’s current five-tuple and ingress interface, apply the narrowest supported filters, and verify that the captured debug output is timestamped and stops promptly.