
A SaaS provider's API tier drops flows intermittently even though the intrusion event log stays empty. While reproducing the problem, an engineer at the FTD CLI needs the verdict Snort applied to each individual packet, including why one packet passed and the next was dropped. Which FTD tool prints each packet's Snort verdict?
Select an answer to reveal the explanation.
Short Explanation
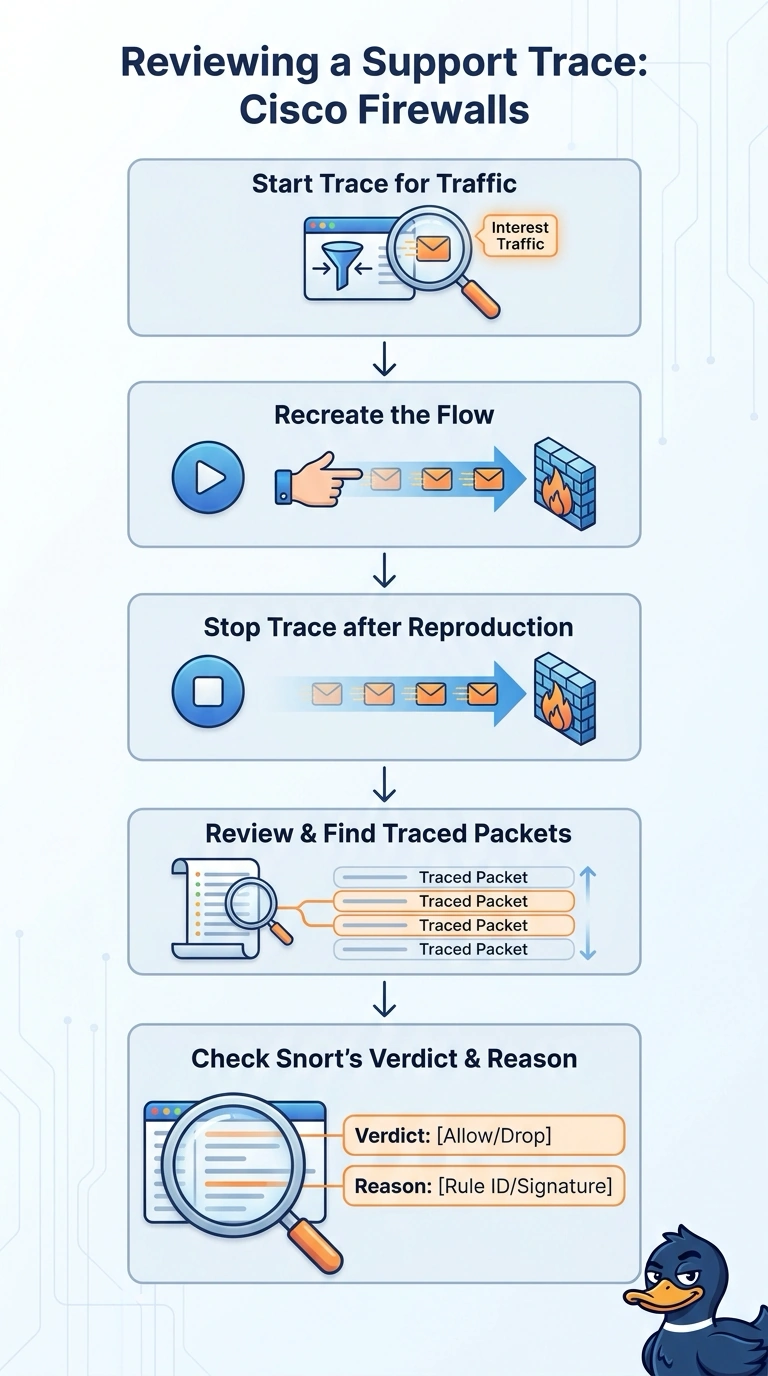
Use the system support trace to see Snort’s verdict and reason for each traced packet. It’s like a play-by-play: you can tell why one packet passed and the next was dropped, unlike with a packet capture or connection events.
Full Explanation
The system support trace is the correct tool because it traces packet processing on the FTD from the CLI and can report the Snort verdict and reason for each packet included in the trace. That directly addresses the need to distinguish why one packet passed while the next was dropped; an empty intrusion event log does not provide that packet-by-packet explanation. A packet capture records traffic contents, such as headers and payload, but does not print Snort’s verdict or its reason, so an analyst can only try to infer the decision. FMC connection events report a recorded disposition for a connection when event logging is configured; they are connection-level records, not a per-packet Snort trace. A diagnostic-data bundle gathers information for later analysis by Cisco support rather than showing verdicts as traffic is reproduced. One exam caveat is that the trace reports only packets that are actually included in its tracing scope, and tracing can be verbose; follow Cisco guidance for the device and software version. As a practical check, limit the trace to the reproduction window, reproduce the intermittent failure, and verify that the trace includes the relevant packets and their verdict-and-reason entries.