
During a live incident, a junior engineer needs to see why one user's connections are dropped by the Secure Firewall Threat Defense engine on a busy production device, and the team wants the trace kept low impact. Which practice should guide how the firewall engine debug is used?
Select an answer to reveal the explanation.
Short Explanation
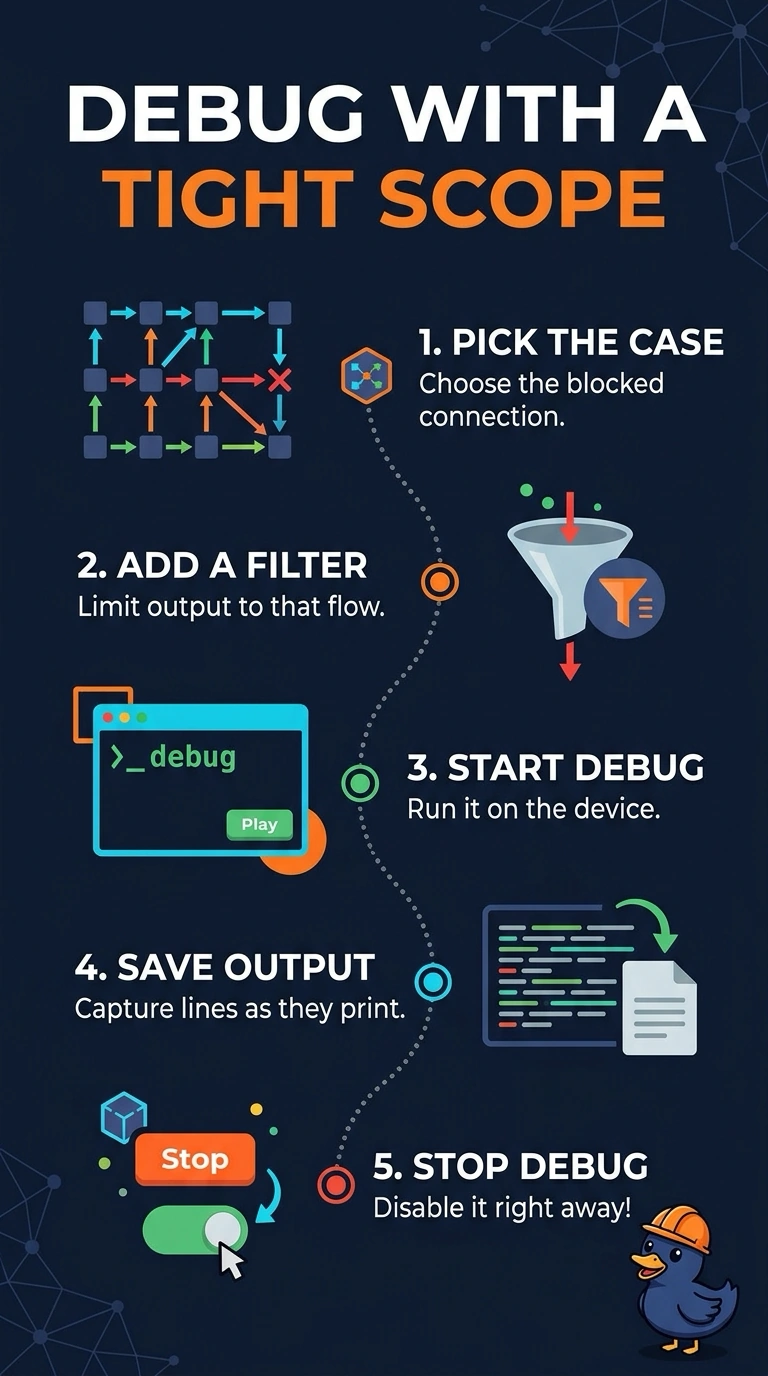
Keep the firewall engine debug on a narrow filter and shut it off as soon as you have the trace. Broad or prolonged debugging can produce substantial output and add load on a busy device. A packet capture records traffic, but it is not a substitute for engine-debug output when investigating the engine's decision.
Full Explanation
The correct practice is to scope the firewall engine debug to the affected connection and stop it immediately after collecting the trace. A busy production device can incur processing and logging overhead from debugging, so limiting both the match scope and the capture duration helps keep the investigation low impact while still collecting evidence for the reported drop. A brief debug with a broad drop filter is time-bounded, but it can still match unrelated traffic across the device; its short duration does not replace the required connection-level scope. A narrowly filtered packet capture is a useful, low-impact way to inspect traffic and correlate events, but it is not a firewall engine debug and may not reveal the engine’s internal reason for dropping the connection. Filtering on the user's whole subnet and stopping promptly controls duration, but can include many unrelated sessions and therefore does not meet the requirement to isolate the affected connection. Exam caveat: debug syntax and available filters vary by Secure Firewall version and platform, so confirm that the chosen filter matches the intended connection fields. Practical check: verify the filter against the affected connection’s addresses, ports, and protocol, then confirm the trace stops and the debug is disabled after capture.