
A data center pair of Threat Defense devices silently drops traffic from a freshly migrated VLAN, yet a recheck of the deployed access control policy shows that subnet permitted. The engineer needs to see which firewall engine phase discards those packets, and the investigation has to stay brief enough to leave production traffic undisturbed. Which troubleshooting technique should reveal that firewall engine phase on the live appliance with minimal disruption to production?
Select an answer to reveal the explanation.
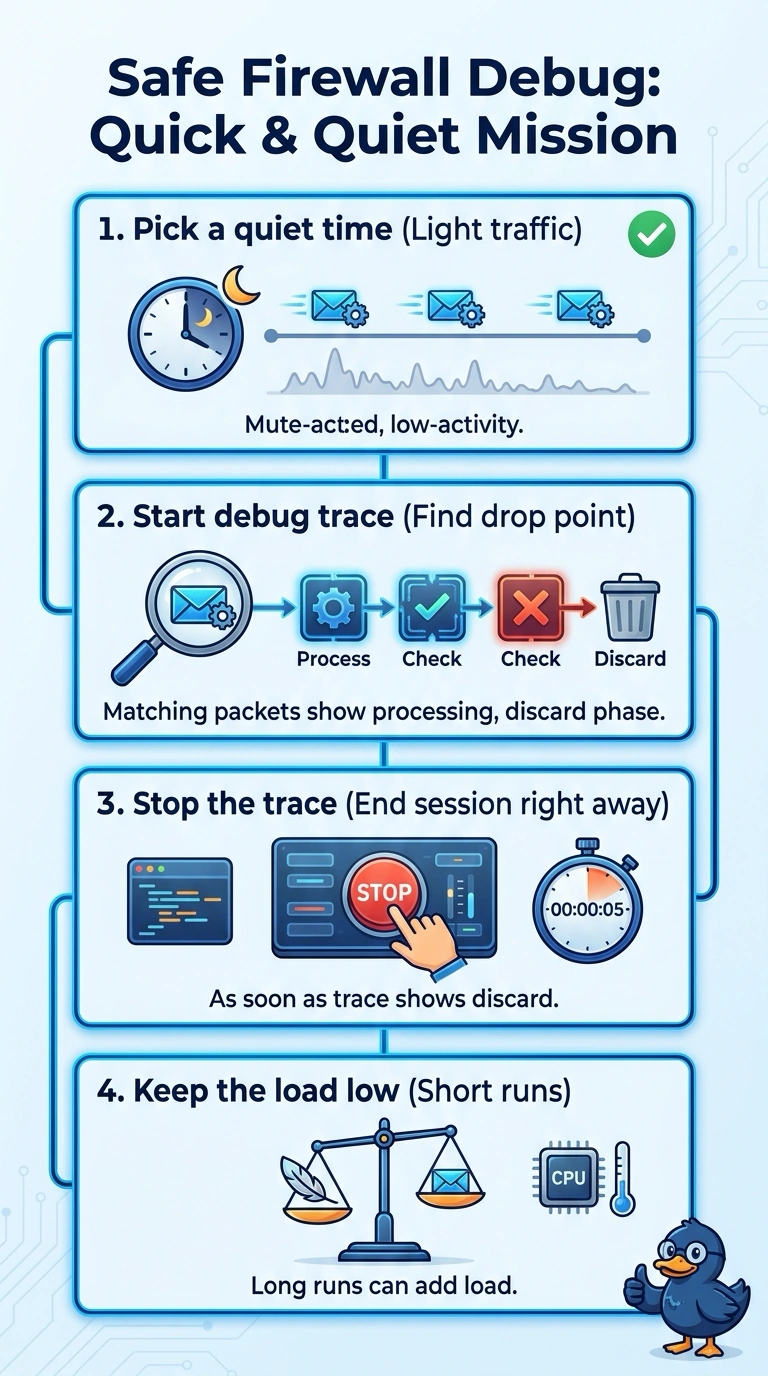
Short Explanation
Firewall engine debug traces matching packets as they are processed by the firewall engine, helping pinpoint where they are discarded. The output can grow quickly, so keep the session short and stop it once you have the answer. It's like a dye test in a pipe: you only need it long enough to see where the color changes.
Full Explanation
A short, planned firewall-engine debug is the direct way to observe the live packet’s processing stages and identify the phase that discards it. Limiting the trace to a brief window and stopping as soon as the relevant phase appears helps contain diagnostic overhead and avoid unnecessary impact on production. Capturing packets at ingress and egress can show whether traffic arrives and whether it leaves, but packet contents do not expose the firewall engine’s internal processing phase; the capture may narrow the location of a failure without answering the specific question. A five-tuple packet-tracer simulation is a useful way to examine the appliance’s predicted handling of a flow, but it models a path rather than tracing the affected live packets, so its reported phase may not explain the observed runtime drop. Connection and drop-reason logs can help establish whether flows are being denied and may identify a general cause, but they do not necessarily record the precise engine phase responsible. Exam caveat: debug commands and their filtering controls vary by Threat Defense version and platform, so confirm the supported syntax before use. Practical check: filter narrowly to the migrated subnet or failing flow, note baseline appliance load, monitor it during the short trace, and stop immediately after capturing the relevant discard phase.