
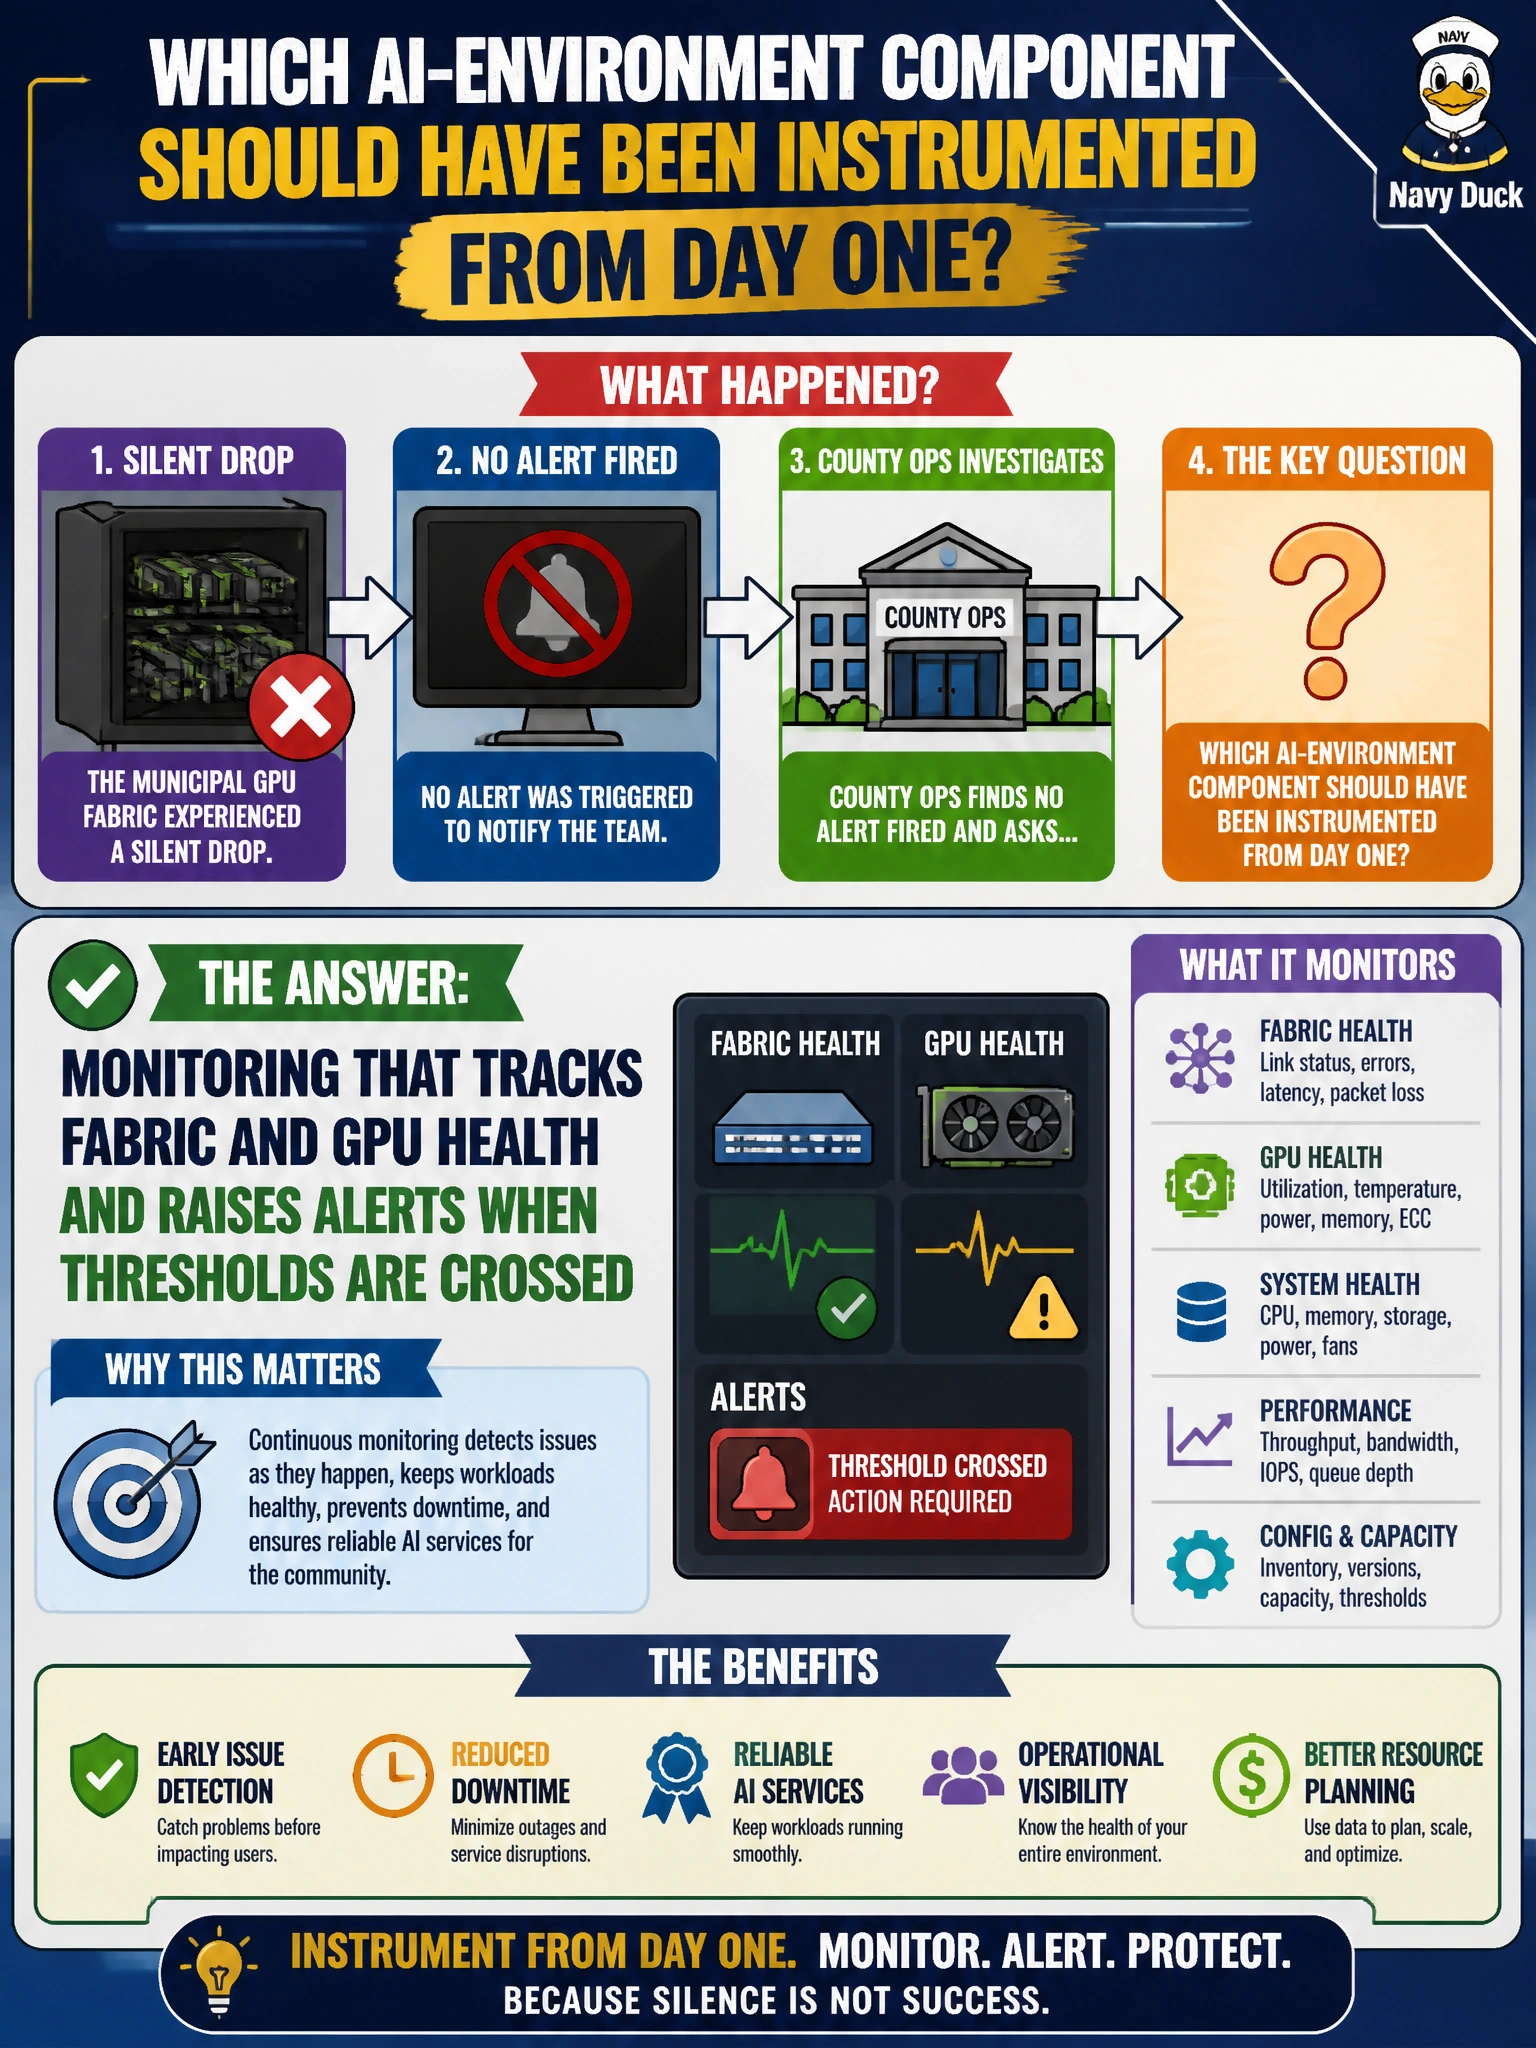
After a silent drop on the municipal GPU fabric, county ops finds no alert fired and asks which AI-environment component should have been instrumented from day one?
Select an answer to reveal the explanation.
Short Explanation
Think of monitoring like smoke detectors in a city hall—you do not wait for someone to smell smoke walking the halls. Without telemetry and alerts on the fabric and GPUs, a silent failure just sits there until citizens feel the outage. Bake monitoring into the AI stack from day one, not as an afterthought.
Full Explanation
After a silent drop on the municipal GPU fabric with no alert, the component that should have been instrumented from day one is monitoring that tracks fabric and GPU health and raises alerts when thresholds are crossed. Telemetry on links, switch health, GPU temperature, power, errors, and job stalls turns silent failures into actionable events for county ops. Monitoring that tracks job queue depth and scheduling delays and pages staff on backlog growth watches the scheduler, not the fabric, and would not have caught a silent GPU fabric drop or raised a fabric-health alert. Monitoring that tracks model accuracy drift and data skew and triggers retraining when scores decline watches model outcomes, not infrastructure, and would not have fired on a silent fabric or GPU hardware failure. Telemetry that collects fabric counters and GPU error logs for trend analysis and capacity planning reports is useful for long-term planning, but it does not raise threshold-based alerts on live fabric or GPU health and would not have prevented the silent drop. Operational check: before production cutover, verify fabric and GPU metrics are collected, thresholds and alert routes are tested with a synthetic fault, and on-call runbooks name the dashboards county ops will use when the next silent drop occurs.
Prefer to study offline? Printable PDF study book + test engine ($7.50, unofficial). These questions stay free here.