
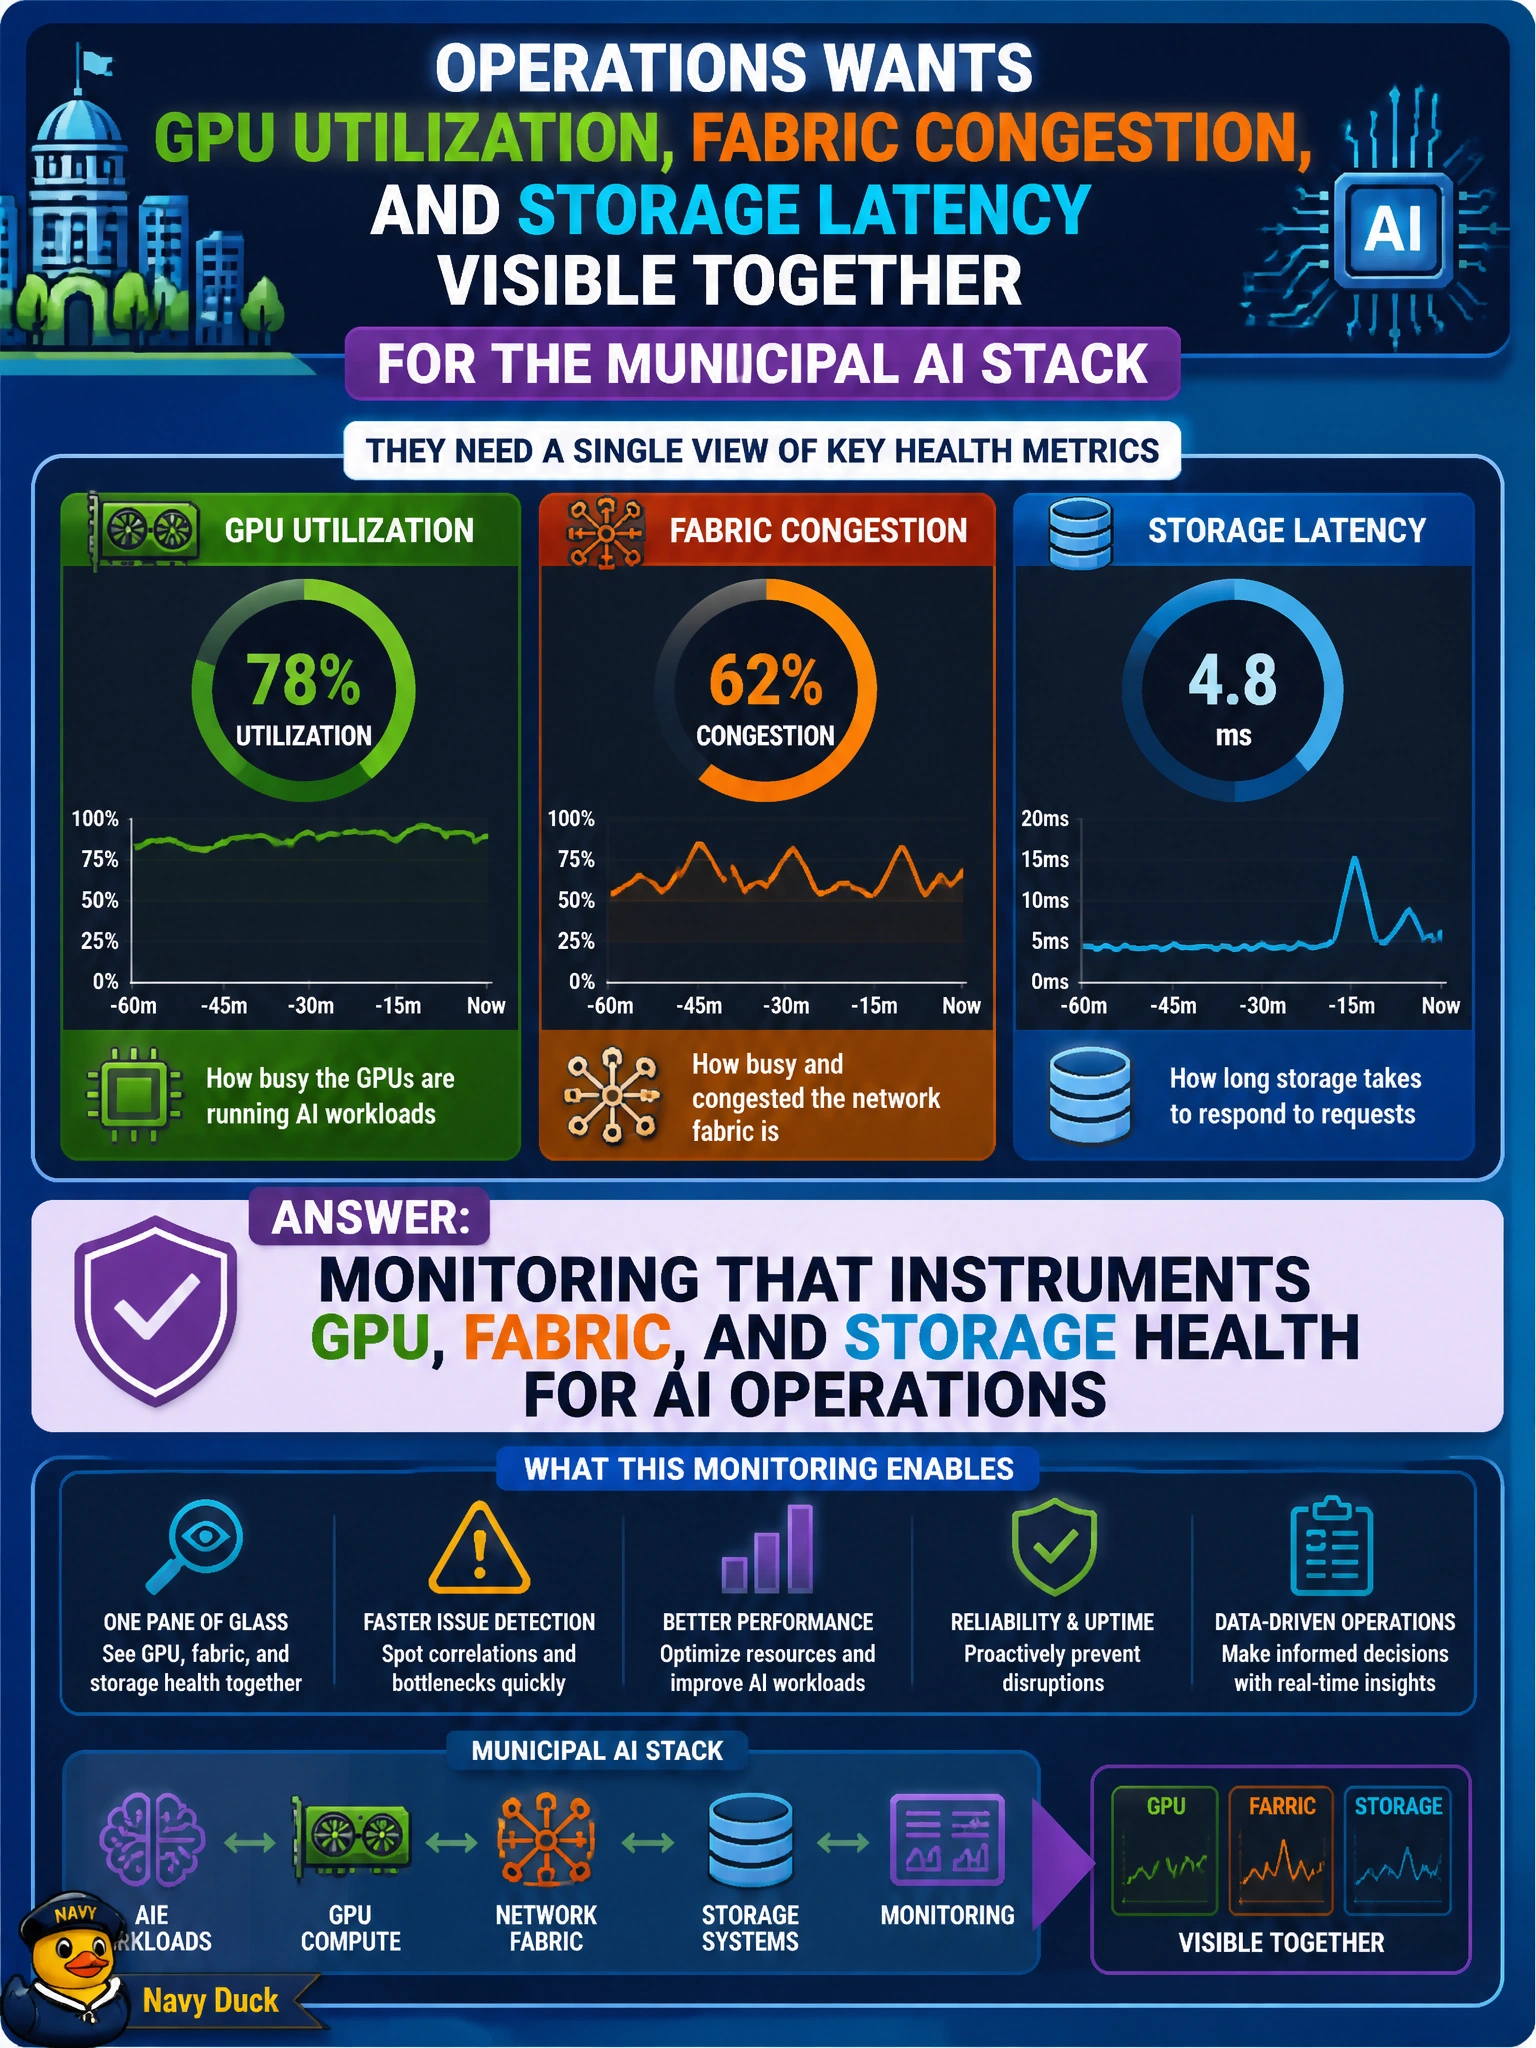
Operations wants GPU utilization, fabric congestion, and storage latency visible together for the municipal AI stack. Which AI environment component are they asking for?
Select an answer to reveal the explanation.
Short Explanation
If you can't see GPU heat, fabric jams, and slow disks in one ops view, you're flying blind. Monitoring is the instrument panel for the AI stack — not centralized logging that archives GPU, fabric, and storage events for audits, distributed tracing that tracks GPU, fabric, and storage spans, or cluster autoscaling that adds GPU, fabric, and storage capacity. Domain basics treat monitoring as a real component, not an optional extra.
Full Explanation
Monitoring that instruments GPU utilization, fabric congestion, and storage latency is the AI environment component operations is asking for. It works because municipal AI stacks fail in multiple planes—accelerators, east-west fabric, and storage I/O—and operators need correlated live telemetry to diagnose slow training or inference before citizens feel outages. Monitoring is a required Domain component, not centralized logging that archives GPU, fabric, and storage events for audits. Centralized logging that archives GPU, fabric, and storage events for audits fails because archived audit records are retrospective compliance storage, not correlated live instrumentation, and cannot surface real-time GPU utilization, fabric congestion, or storage latency in one ops view. Distributed tracing that tracks GPU, fabric, and storage spans for operations fails conceptually: tracing per-request spans does not provide the correlated GPU, fabric, and storage health telemetry operations needs to triage the AI stack. Cluster autoscaling that adds GPU, fabric, and storage capacity for operations fails because autoscaling is a remediation action, not the visibility layer operations asked for; it does not make GPU, fabric, and storage latency visible together. Exam caveat: collecting metrics without actionable alerts, thresholds, and named owners still leaves the municipality blind during incidents even if dashboards exist. Operational check: deploy dashboards and alerts covering GPU utilization, fabric congestion, and storage latency together; run a known-slow training or inference job and confirm signals appear in one ops view; reject centralized-logging-only, tracing-only, or autoscaling-only substitutes for the monitoring component.
Prefer to study offline? Printable PDF study book + test engine ($7.50, unofficial). These questions stay free here.