
A NOC dashboard built on SD-WAN Manager must show the current CPU and memory for one edge router, refreshed live on the wall screen, and a seven-day tunnel throughput trend for a weekly report. Which pair of API calls should the script build to serve both needs?
Select an answer to reveal the explanation.
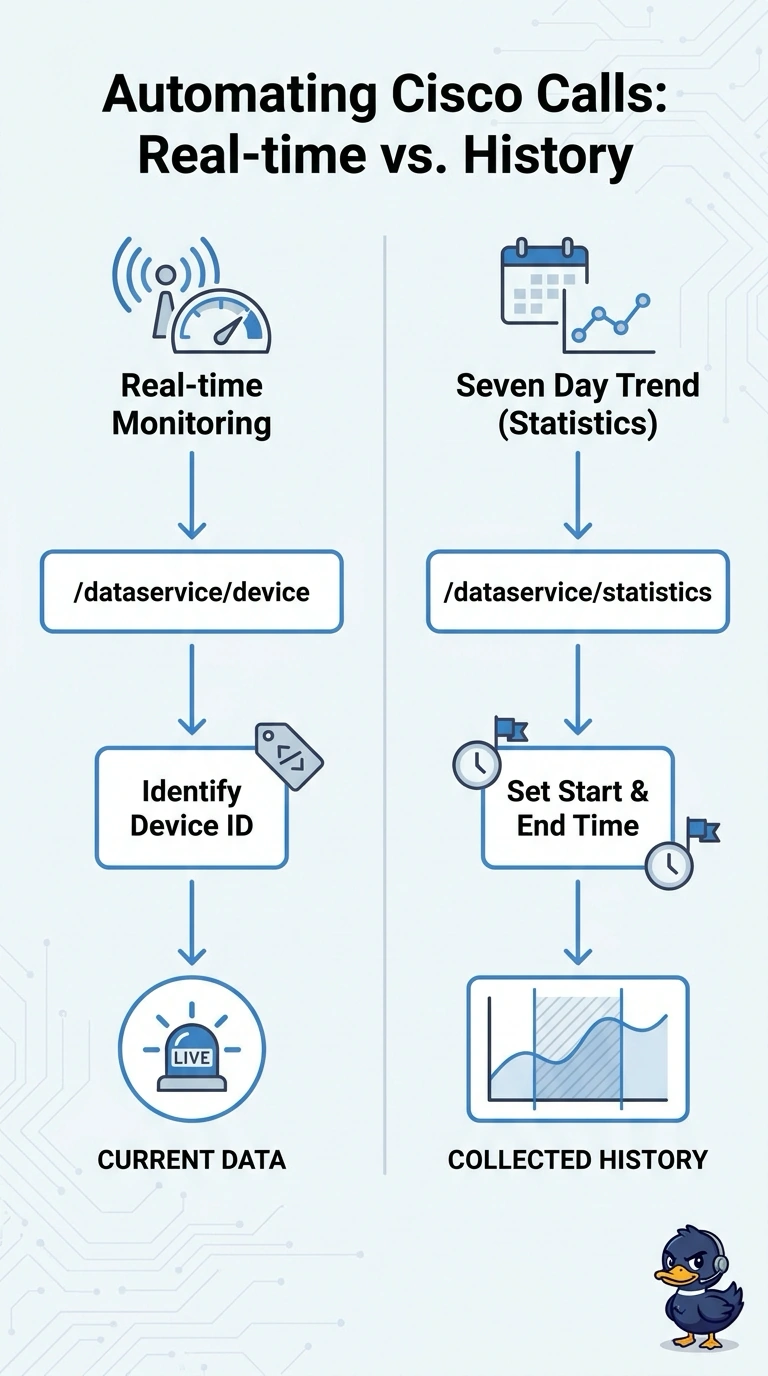
Short Explanation
For your live CPU and memory gauge, use a real-time monitoring endpoint under /dataservice/device—it’s a snapshot of what’s happening now. For your seven-day throughput trend, use a statistics endpoint under /dataservice/statistics with a time window, like looking back through a week’s scrapbook.
Full Explanation
The correct pairing uses a real-time monitoring endpoint under /dataservice/device for the edge router’s current CPU and memory, and a /dataservice/statistics endpoint with a seven-day time window for tunnel throughput. These API families serve different data: real-time monitoring provides current device measurements for a live wall-screen gauge, while statistics provides collected time-series data suitable for a historical trend and weekly report. Using the statistics family for both needs is the short-window time-series approach; shortening the window may return recent samples, but does not turn collected statistics into the real-time monitoring interface. Using the real-time device endpoint for both is the current-state monitoring approach; adding a seven-day range does not make that endpoint a historical statistics source. Using the alarms and events feed for CPU and memory applies an alert/event approach to continuous measurements: that feed reports alarms and events, not ongoing device metrics. Exam caveat: exact endpoint paths and parameters vary by endpoint and SD-WAN Manager release. Practical check: consult the API documentation for the controller version in use, then verify that the monitoring response contains current CPU and memory values and that the statistics response spans the requested seven days.