
During a WAN outage, a NOC engineer must read current CPU and interface state for the affected edges right now, while a manager wants a chart of interface errors across the past seven days for a weekly report. Both come from SD-WAN Manager. Which monitoring request design serves the live query and the seven-day trend query?
Select an answer to reveal the explanation.
Short Explanation
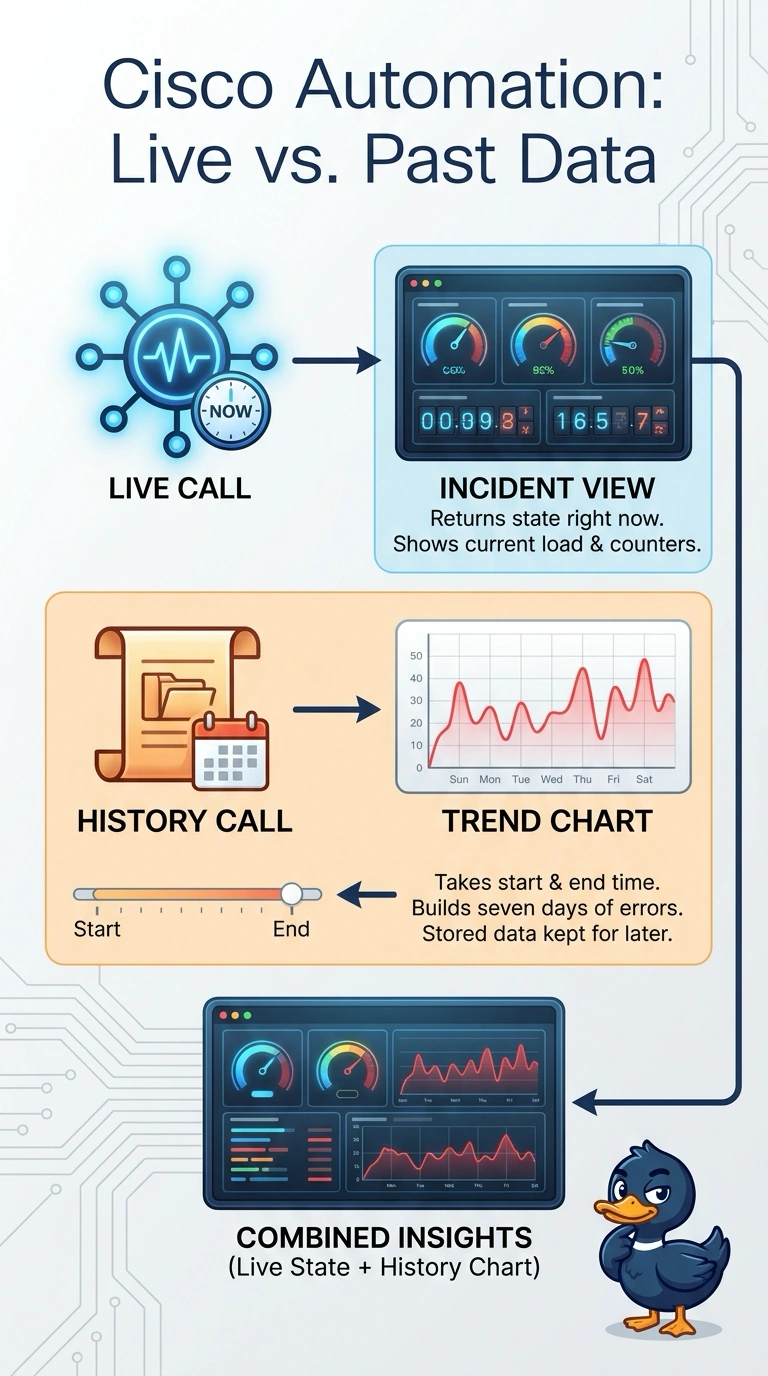
Your incident needs the state as it stands right now, and the weekly report needs stored samples across a whole week. A real-time endpoint answers the live question, while a history endpoint answers the range one. You'll lean on both in the same shift.
Full Explanation
SD-WAN Manager splits its monitoring surface by time semantics. A real-time endpoint answers an on-demand query and returns the current state of devices and interfaces, which is what an engineer under pressure needs during an outage, and you can poll it repeatedly for near-live values. A history endpoint is the stored timeseries side: it takes a start and end time and returns the samples kept for that window, which is what a seven-day chart is made of. Using history for the incident fails because stored samples refresh on collection intervals and lag the present, so they will not show the state right now. Handing a real-time endpoint a long time range fails because it reports the present rather than serving a stored window, so no chart can be built from it. A monitoring snapshot fails because a capture spans a short troubleshooting window rather than weeks of retained trend data. Caveat: query parameters and retention windows vary by release, so check the current API guide. Practical check: call a live utilization endpoint and its history counterpart side by side, then compare the timestamps each returns.