
An engineer is building a branch dashboard in Python against SD-WAN Manager. One panel must show the router's current interface error counters and refresh often, while another must report average CPU across the whole site for the past seven days in hourly slices. Which pair of monitoring endpoint styles should the script use for these two panels?
Select an answer to reveal the explanation.
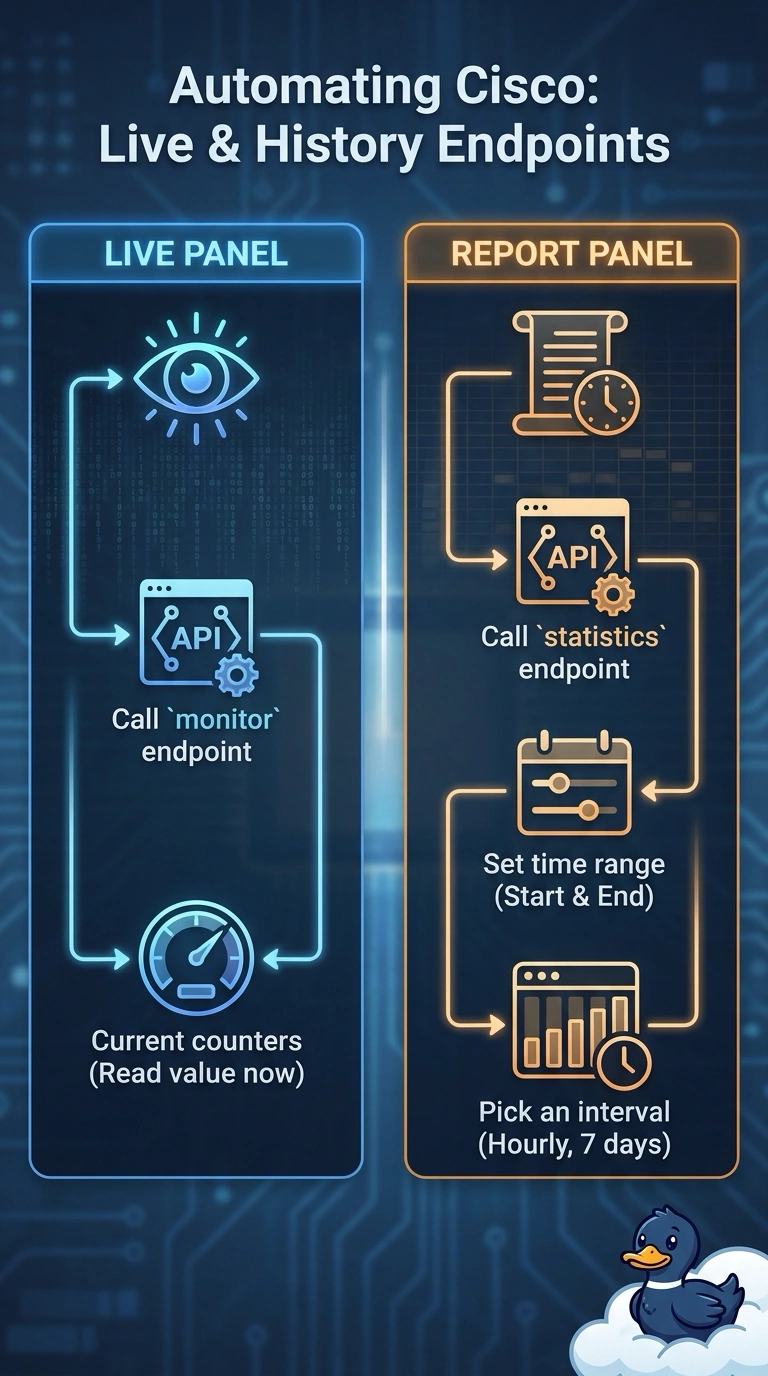
Short Explanation
Use the real-time monitor endpoint to refresh your router’s current interface error counters, and the statistics endpoint with a seven-day range and hourly intervals for site-wide average CPU. It’s like checking a live thermometer versus reviewing last week’s logbook.
Full Explanation
The real-time monitor endpoint is the appropriate source for interface error counters that should reflect the router’s current state and refresh frequently. The statistics endpoint is designed for time-series reporting, so it can return CPU measurements across the requested seven-day window at hourly resolution; site-wide averages also require the site-level scope or aggregation. Using the statistics endpoint for both panels is plausible when a dashboard favors a consistent historical data path, but even a recent one-minute bucket is a sampled statistic, not a guarantee of the router’s current counters. Requesting hourly CPU data per device preserves the time range and resolution, but does not produce the required average across the whole site unless the results are correctly aggregated across site members. A device health endpoint can be useful for current operational status, yet interface status is not the same metric as interface error counters; it cannot substitute for the requested counters merely because it is current. Exam caveat: endpoint names and available dimensions vary by SD-WAN Manager version, and “real-time” does not necessarily mean instantaneous or unpolled data. Practical check: inspect the returned timestamps, counter fields, and site/device identifiers, and verify that the CPU response contains one hourly site aggregate for each expected interval.