
Your operations team runs a morning health script for the SD-WAN fabric. It must chart bytes in and out on one branch router's WAN interface for a fixed two-hour window that ended an hour ago, so the script has to name the range itself rather than accept a preset look-back. Which request pattern puts the fixed two-hour range into the statistics query call?
Select an answer to reveal the explanation.
Short Explanation
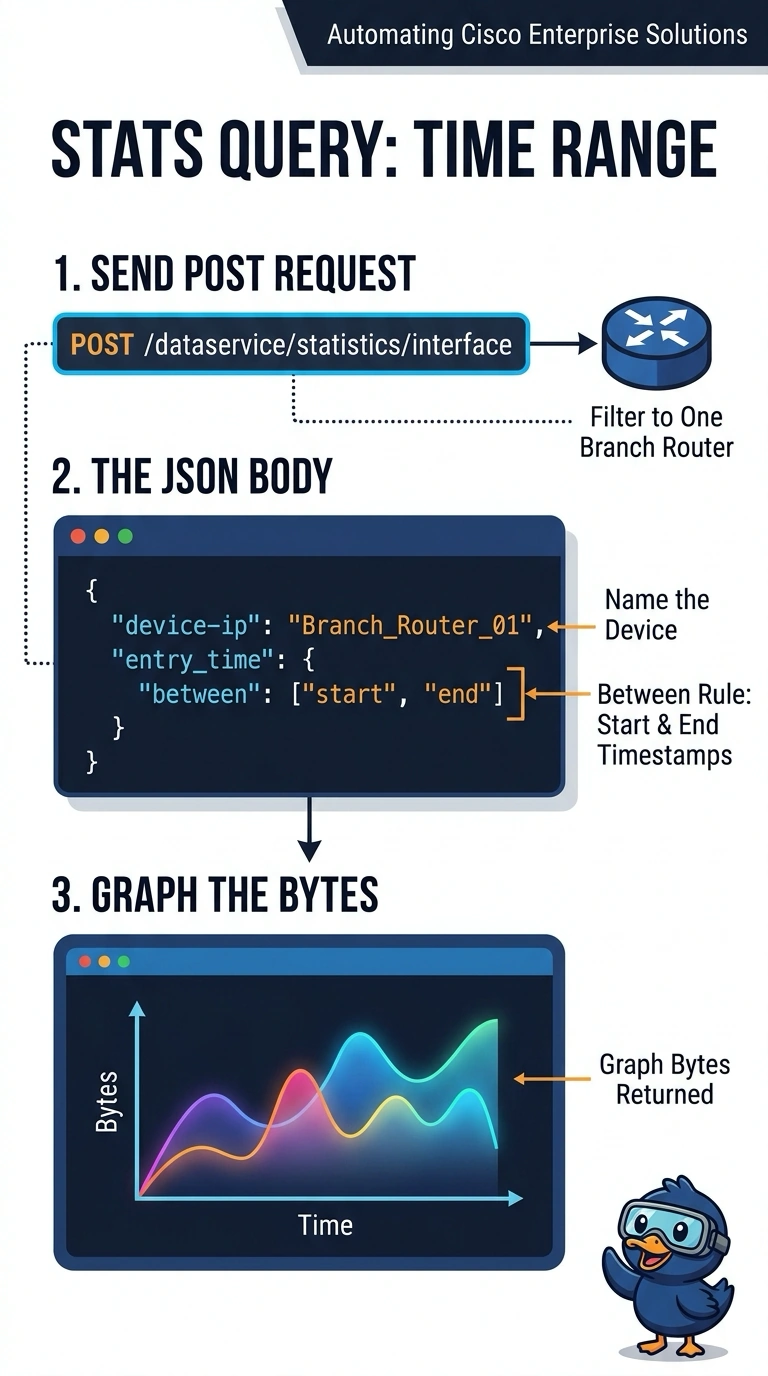
You can set the exact past window by putting both timestamps in an entry_time between rule in the POST body. That gives your script the two-hour period that ended an hour ago, rather than shifting the range to end now.
Full Explanation
The correct pattern sends a POST to /dataservice/statistics/interface with an entry_time between rule containing both explicit timestamps in the JSON body. This lets your script name the fixed two-hour interval that ended an hour ago; the request must also select the branch router’s WAN interface and both inbound and outbound byte counters to meet the charting requirements. Requesting only received-byte counters leaves out transmitted bytes, so it cannot chart both directions, even if the time range and interface filter are right. Omitting the WAN-interface filter and aggregating the router’s interfaces may return byte statistics for the right period, but it does not isolate the required interface. Using both timestamps in a range that ends at the current time is a valid query pattern for a recent interval, but it selects the wrong period by shifting the window forward an hour. Exam caveat: statistics field names, filter syntax, and timestamp formats can vary across API versions, so check the documented schema rather than assuming a counter label. Practical check: inspect the response to confirm it identifies the requested device and WAN interface, includes both byte directions, and has earliest and latest timestamps within the specified boundaries.