
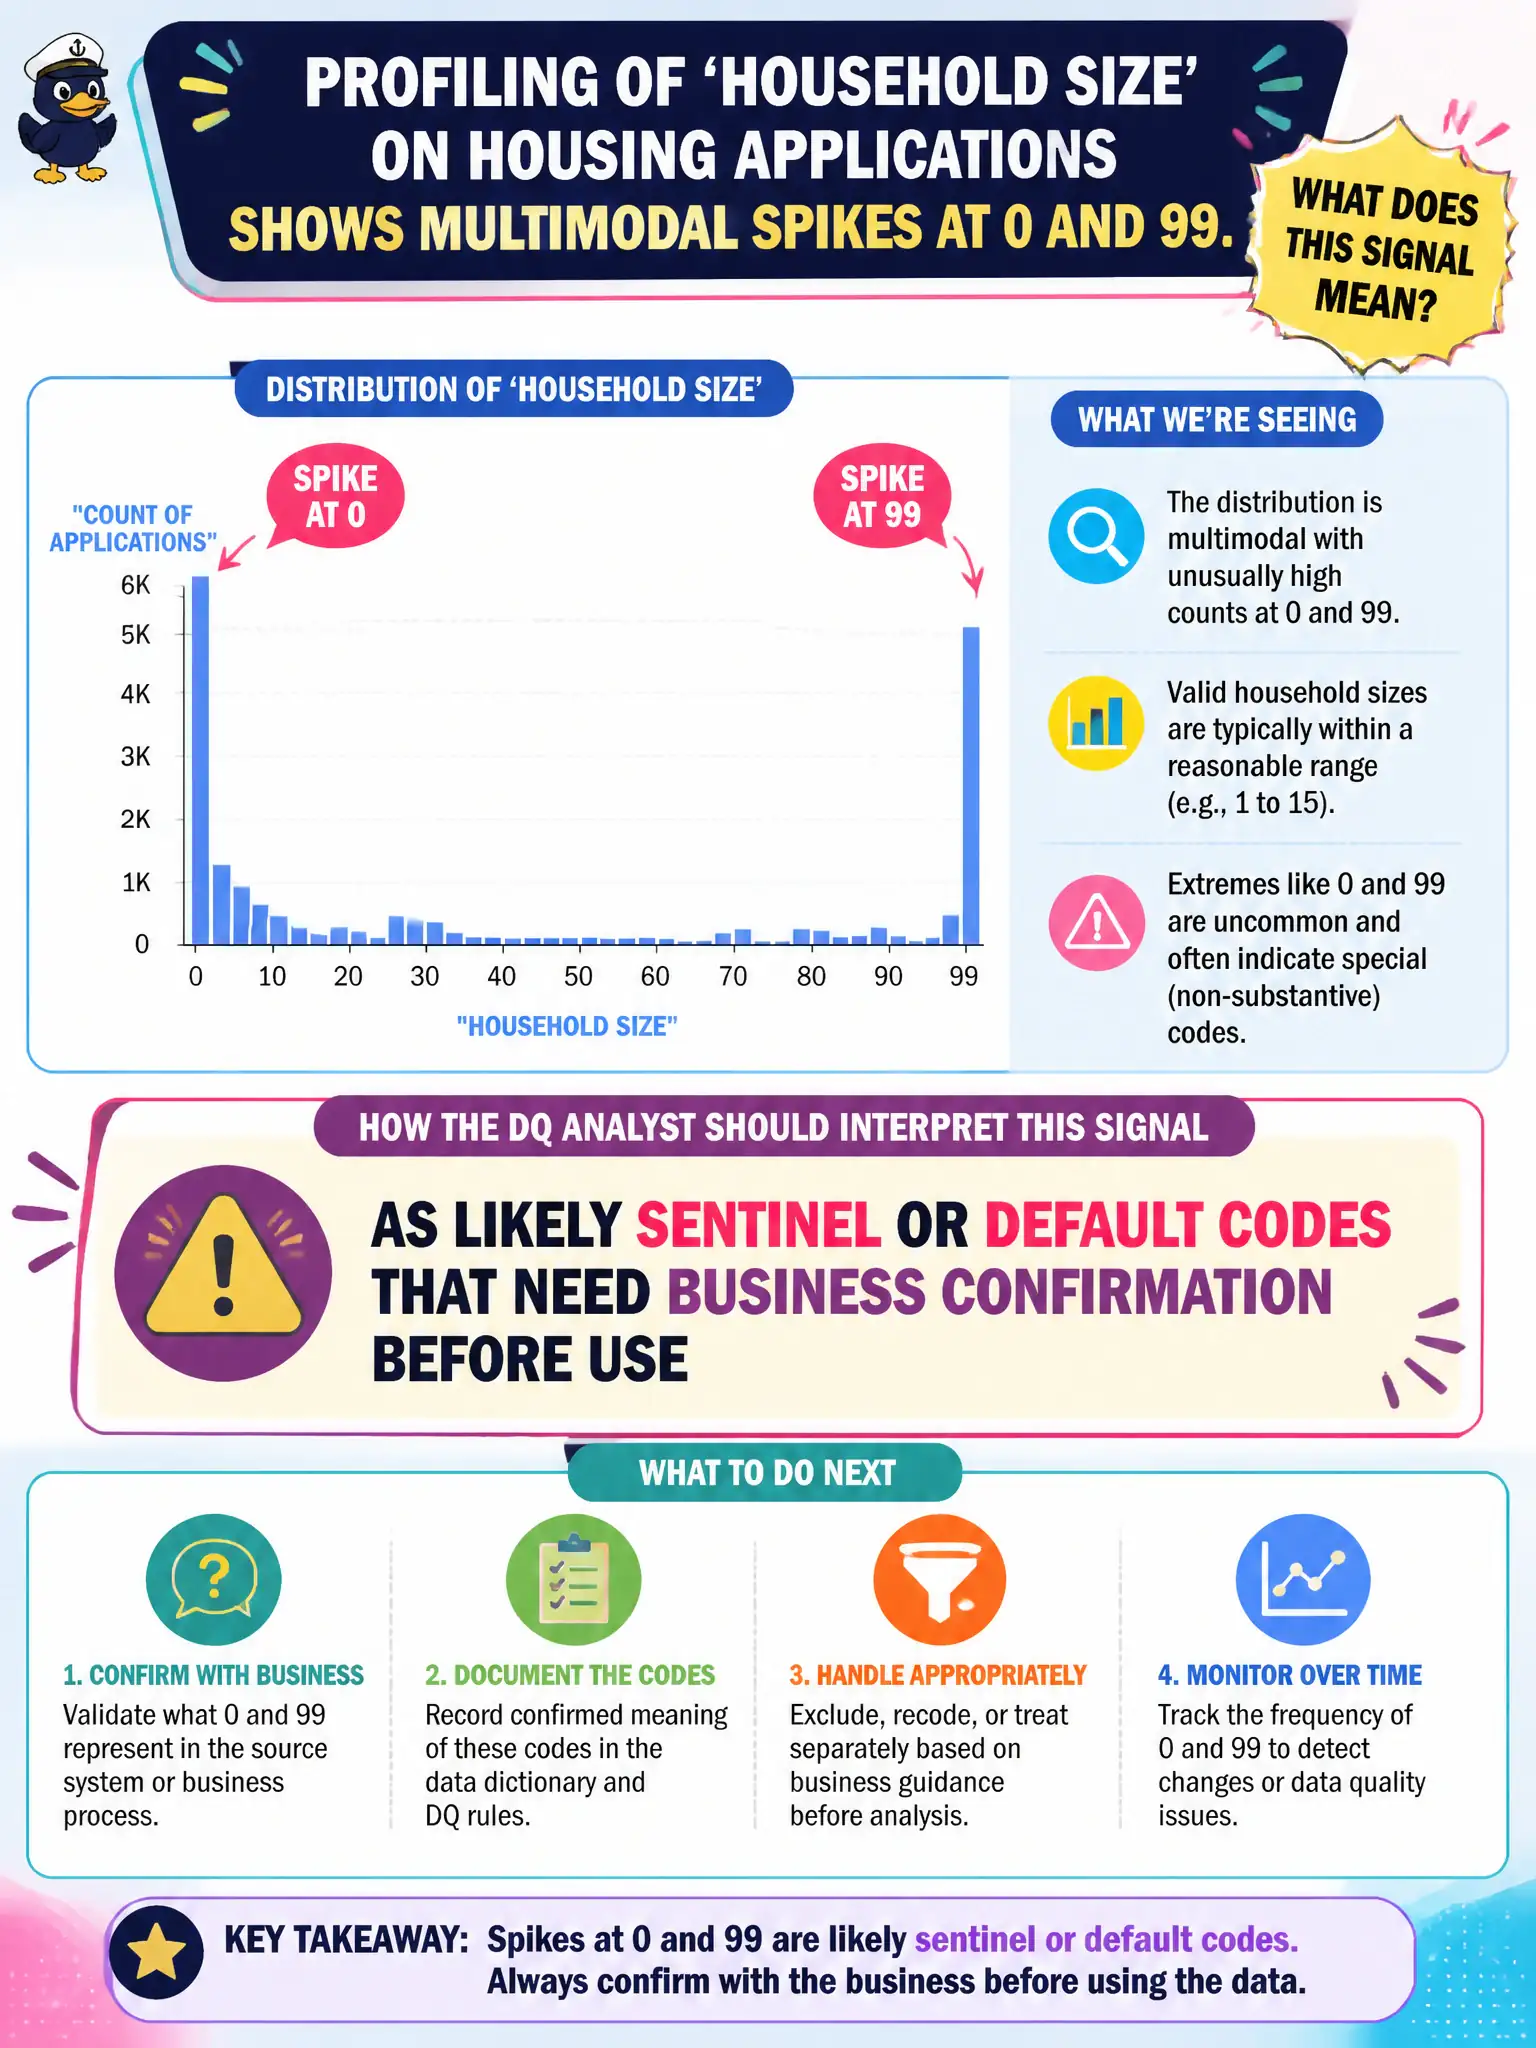
Profiling of 'household size' on housing applications shows multimodal spikes at 0 and 99. How should the DQ analyst interpret that signal?
Select an answer to reveal the explanation.
Short Explanation
Spikes at 0 and 99 in household size are like speedometers stuck on 'park' and 'max'—often codes, not real homes. Profiling patterns like that usually flag sentinel or default values. Confirm the business meaning before trusting the numbers.
Full Explanation
Multimodal spikes at extreme values often signal sentinel or default codes that need business confirmation before analytic use in civic programs. Profiling 'household size' on housing applications that shows spikes at 0 and 99 should be read as likely sentinels or defaults—not proof of accuracy, automatic fraud, or an excuse to drop the field without review. Treating dominance of common values as proof the field is already accurate misses that sentinels can dominate precisely because they are system defaults or hurried clerk shortcuts. Dropping the field from all analytic models without review may discard a usable attribute once codes are cleansed, remapped, or captured with better guidance. Assuming multimodal distributions always mean fraud overclaims statistically and can unfairly target applicants in public housing and benefits programs. Exam caveat: confirm sentinel meanings with the application owner; different municipal programs may use 99 as 'unknown,' 'prefer not to say,' or a legacy overflow code. Operational check: interview the form owner, document sentinel semantics in the business glossary, exclude or remap them for official household-size statistics, and add capture help-text to reduce misuse at intake. Housing and planning analysts should publish whether reported averages include or exclude sentinel-coded rows so policy debates are not based on polluted civic statistics.